Big Bear lakefronts often experience different price and sales trends than those seen in the overall real estate market. There are many reasons why this is the case.
For instance, lakefronts are far more affected by Big Bear Lake's water levels. Looking at historical sales numbers, sales are generally down in the low lake level years and higher when the lake is closer to full. As well, lakefronts tend to be among the most expensive properties in Big Bear which oftentimes bring different concerns when purchasing, such as potential tax consequences or specific expectations of a property's condition. Lastly, the number of lakefronts listed at any given time tend to be quite limited. So although we may have well qualified buyers, there may not be the type of lakefront they are looking for on the market, thus suppressing the number of purchases.
Because the lakefront real estate is so different, it deserves to be looked at differently than the market as a whole..
Before reviewing the information below, keep in mind that the very small sample size of sold lakefront properties each year can make sales numbers more difficult to interpret. For example, it only takes one very inexpensive or one very expensive sale to significantly sway the sales data one direction or the other. My role as an agent is to know the details about the specific lakefront properties that sold so that an accurate interpretation can be made on what's going on in the market. That is what I hope to accomplish in the following review.
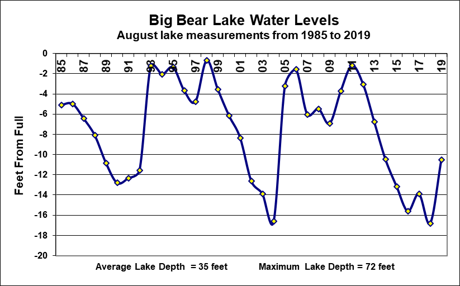
In this regard, let's take a look at 2019's sales numbers in the figure below. After a very slow sales year in 2018 when the lake's water levels were the lowest they'd been in almost 50 years, we saw a bump in sales after the wet, snowy winter added 9 feet to the lake's elevation. Unfortunately, the lake still remained over 10 feet from full which hampered the sales rebound somewhat, leaving many prospective lakefront buyers hesitant about the lake's water levels. Hopefully with the stormy winter we've had so far this year, our lake's water levels will be closer to full come next summer.

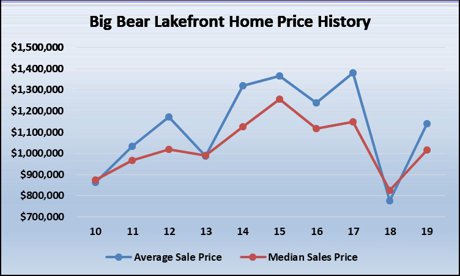
Looking at the figure below, you'll see that the average and median sales prices and prices per square foot of lakefronts rose this year as well. Although this is the case, as previously mentioned, lakefront sales numbers often need interpretation.
For instance, the figure below shows that the average sale price fell almost 50% last year, but that does not mean the actual value of lakefronts fell to that extent. With the lake hitting a 50 year low in 2018, many shallow water lakefront owners lowered their list prices significantly to get sold. These shallow water homes tend to be less expensive in general, and with the owners willing to take even less due to poor lake conditions, many buyers picked these homes up at a bargain price in exchange for assuming the low water level risks.
Although prices bounced back somewhat, we still had quite a few sales in the lower price ranges this year as well as many lakefronts that needed significant improvements. This hampered the price rebound.
Again, this sales price history should not be applied to each individual property but still can be a guide to explain what's going on in the market. The most accurate way to know a particular property's value is to have an agent familiar with the lakefront market do a comparable market analysis.
Price per square foot measures also need to be interpreted taking into consideration the nature of the lakefronts that sold. As mentioned above, many of the homes that sold were older and in need of updating, remodeling, or other improvements. These homes sell at a lower price per square foot than homes that are newer or fully remodeled already. Again, each individual property is different and simply applying the price per square foot average to the square footage of one's property would likely not provide an accurate valuation.
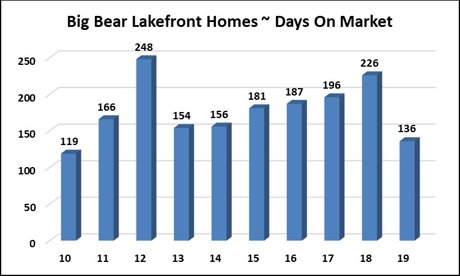
You'll see below that the average time a home was on the market before selling fell significantly this year. In fact, 2019 had the lowest D.O.M. in almost a decade. Again, being familiar with the individual lakefront sales in 2018, the D.O.M. that year was unusually high due to long-listed shallow water lakefronts finally selling. 2019's D.O.M. offers a more accurate reflection of true time on market.
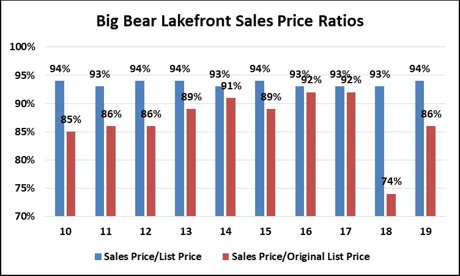
The sales price to list price ratio figure below shows not only how much lakefront owners dropped their list price in negotiations, but it also showed how much sellers conceded off their original list price. These numbers also reflect how the average lakefront seller dropped their original list price before receiving the offer which they subsequently negotiated. This suggests there were many sellers that tested the market at a higher price before finding it necessary to lower their list price in order to get sold.
Lastly, lake levels undoubtedly have an effect on lakefront sales. Case in point, in the last decade, the highest number of sales was in 2012 when the lake was near full and the lowest was in 2018 when the lake was at its lowest point in 50 years. As previously mentioned, the lake filled a significant 9 feet last winter but was still almost 10 feet from full. Unfortunately, many buyers were still hesitant due to the remaining low water levels. If we continue to get the storms we've had so far this winter, the lake will most certainly be closer to full come summer.
In addition to these sales figures, there are a couple other issues to consider that affect the lakefront market.
New tax laws limit the amount of mortgage you can deduct as well as no longer offer a deduction for state property taxes. I have had several buyers mention this concern when deciding whether to buy. I would assume this will be become "the new normal" though and be a less common concern for buyers in the future.
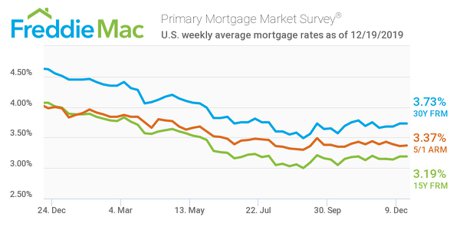
On a more positive note, mortgage rates have remained historically low, having stabilized after dropping through most of 2019. These low rates have really helped the push the current bull market in real estate into it's 10th year.
Lastly, a few items to note that you might find interesting about 2019's lakefront sales:
The highest priced lakefront to sell was $2,600,000 and the lowest was $425,000.
The highest price per square foot was $528 and the lowest was $375.
The longest days on market was 447 while the shortest was 4.
The highest sales price to list price ratio was 101% and the lowest was 93%.
The biggest home was 6 beds, 6 baths, 5107 sf and the smallest was 2 beds, 1 bath, 1245 sf.
The lake's highest water level was 9"2" from full and the lowest was 12'1" from full. (The lake typically loses about 3 feet mostly due to evaporation over the summer months.)
Overall, 2019 was a nice rebound from a less than stellar 2018 year for lakefronts. With the economy still going strong, with continued improvements at the resorts and in the community attracting more visitors, and with remarkably low mortgage rates, I think 2020 will be a busy year in the Big Bear lakefront real estate market.
Paul Zamoyta ~ info@Zamoyta.com ~ 909.557.8285