Per my previous blog post, here are some graphs that help visualize the history and current state of the Big Bear lakefront real estate market.
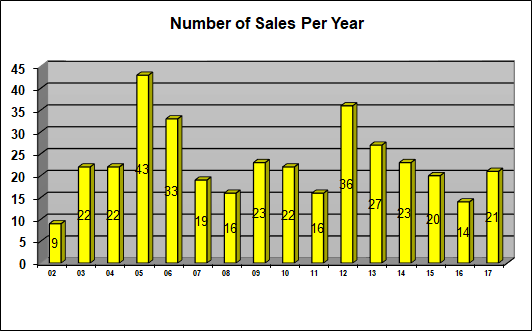
You'll can see in the above figure that sales rebounded from last year's 15 year low. This slow sales rate was due to the low water levels of Big Bear Lake. In 2004, the lake was also experiencing low water levels. But when the lake nearly filled after a snowy and rainy early 2005, sales hit a record high. I would expect the same trend to occur with sales increasing significantly when Mother Nature finally arrives and the lake returns to full.

You can see that lakefront home prices have consistently improved since the market bottom in 2010. But we are still about 10%-20% behind peak prices experienced during the artificially inflated 2006-2007 market.

The price per square foot of Big Bear lakefronts appears to be recovering but more slowly than sales price. This seems to be due to larger homes selling which by nature have a lower price per square foot. Many of the smaller homes are built in shallower water areas, so I would expect this number to jump when the lake fills up again.