Lake Level History
In the midst of one of Big Bear's driest winters on record, there seems to be continued concern about the effect that Big Bear Lake's low water levels may have on real estate sales. If you've lived in Big Bear long enough, you've seen the lake this low before. In fact, if you look at the records from the Big Bear Municipal Water District, you'll see what appears to be somewhat of a pattern in the fluctuation of lake levels over time.

Noticing the up and down nature of the lake's water levels, it is interesting to see how it takes several years for levels to decline yet the lake typically bounces back much faster. Two examples of this are when the lake filled 12 feet in 1992-1993 and 10 feet in 2004-2005. This leaves hope that if and when Mother Nature does decide to show up, the lake can - and historically does - fill up quickly.
Also note that the graph above shows measurements for the month of March. Typically, the lake will lose between 3-5 feet of water from its high point in the spring to its low point in the late fall. For example, when the lake was at this low a level back in 2004, the high point of the lake was in April when it was 14 feet 2 inches from full. By October of that year, the lake hit a low of 17 feet 6 inches, representing a drop of 3 feet 4 inches over the summer months.
If the lake has similar declines this summer, we may see the lake drop to 18 - 19 feet from full, which would be the lowest point in the 32 years that the BBMWD has kept records.
Miracle March?
As of late, I have heard a few local optimists predicting another "Miracle March", suggesting that the lake may still see significant help before winter's end by a potential flurry of late season storms.
The legendary and renowned "Miracle March" occurred in 1991 when Big Bear received 24.24 inches of precipitation, much of it in the form of snow, during the 31 days of March. In comparison, here are the precipitation numbers in inches for the month of March over the last five years; 1.08, 3.33, 1.28, 2.48 and 1.48. So the 24.24 inches from March of 1991 made for quite a white and wet month and is deserving of legendary status.
But how much of a difference did 1991's Miracle March make for the lake's water level?
In February of 1991, right before the "miracle", the lake was at 14 feet 6 inches from full. The high point of the lake later that year was 11 feet from full. So even with over 24 inches of precipitation in March, the lake level only rose 3.5 feet that year. In short, although a March Miracle would be welcomed, it might not result in the water level rebound one would expect.
Do Lake Levels Affect Big Bear Home Sales?
Ultimately, there are too many factors to be reliably certain of the water level's influence on Big Bear home sales. But looking at some of the sales data from 2004-2005, when the lake rebounded from 17 feet from full to just 3 feet from full in one winter, might give us some insight.
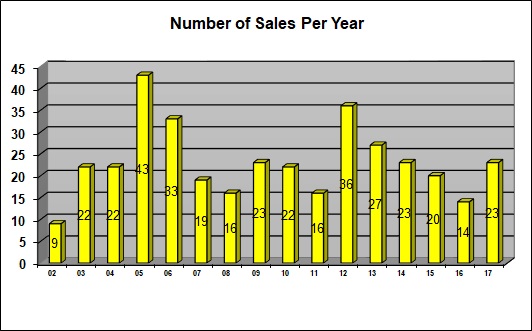
Take a look at the history of Big Bear lakefront home sales:

Note that lakefront home sales almost doubled from the 'low water year' of 2004 to the 'high water year' of 2005. This data certainly suggests that lake levels likely play a significant part in lakefront home sales. Also note that the second highest year for lakefront home sales was 2012, when the lake topped out at almost full capacity.
When we look at home sales for the overall Big Bear real estate market though, there were 1905 total sales in 2004 and 1802 total sales in 2005. So while sales of lakefront properties almost doubled when the lake filled up, overall sales were relatively unchanged, and in fact declined a little.
In my opinion, this strongly suggests that lakefront home sales can significantly be affected by Big Bear Lake's water levels, yet they have little bearing on the overall real estate market (non-lakefront) in general.
What Does this Mean for Lakefront Buyers and Sellers?
For sellers, it's really a bet as to if and when you think the lake will fill up again and whether you could take the proceeds from selling at a lower price today and invest it elsewhere for a greater, more assured profit over time.
For buyers, it is a bet as to how long it will take for the lake to fill up and potentially see significant gains on investments. For lakefront buyers, buying low and selling high has a literal meaning. If you buy when the water is low at a discount, you may be able to sell for significantly more once the lake levels are high.
Summary
Quite simply, we're likely to see some pretty low lake levels this summer. Before panicking, it's important to realize that the lake has historically had its ups and downs. Although lakefront home sales may be affected, the overall market will likely not be influenced much.
For lakefront buyers and sellers, it's really a guessing game as to when the lake's water levels might see better days again. Absent a crystal ball, nobody can tell you the future of Big Bear Lake. But referring back to the lake level graph at the beginning of this post, the previous patterns suggest we might see the lake levels bouncing back sooner rather than later.