In a same month comparison for June, sales stayed steady as 105 Big Bear homes sold this past month matching the same number of homes sold in June 2015.
Although sales remained steady, all four price measures showed appreciation.
The average and median Big Bear home prices rose 22% and 34% compared to last June to $288,845 and $255,000 respectively. These impressive price increases are somewhat deceiving. In looking closer at the data, these price jumps can be attributed to a small sample size of sales being skewed by a few very high end sales.
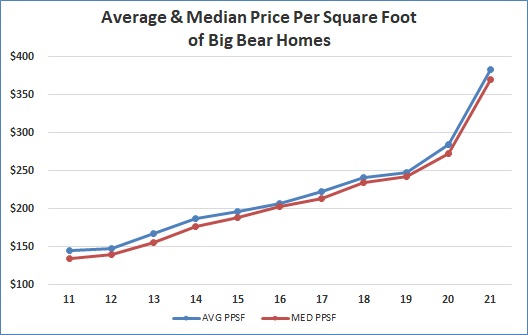
The average and median prices per square foot show a more accurate measure of market direction with both rising 10% to $203 and $204 respectively.
Looking at a quarterly comparison of Big Bear home sales, we see sales dropping in this year's second quarter to 271 closings, down 8% from the second quarter of last year.
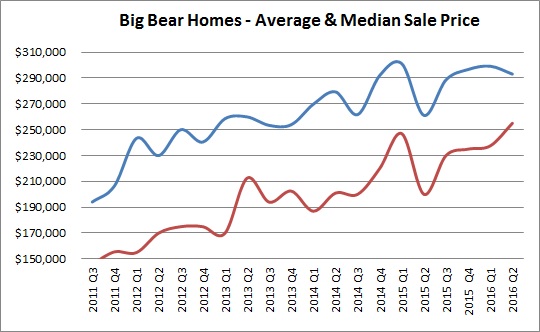
Although sales are down, all four price measures are up, with the average and median price per square foot both up 12% to $207 and $200 while the average and median sale prices of Big Bear homes rose 12% and 28% to $293,031 and $255,000 respectively.
The average number of Days On Market declined slightly from 87 days to 76 days with the average sales price to list price ratio staying steady at 97%.
The number of Big Bear homes for sale has stayed constant with approximately 5.7 months of inventory currently as compared to a 5.9 month supply last June.
Home mortgage interest rates remain unbelievably low hovering in the 3.75% to 4.25% range.
So things are still looking up heading into what is traditionally our busiest time of year for home sales. July, August and September are usually the three months in which we typically see our highest number of closings. Stay tuned to see if this trend continues in 2016!