October sales were up 33% over last October with 157 closings of Big Bear homes.
Prices of Big Bear homes continued to appreciate with the average and median sales prices up 6% and 12% to $359,543 and $285,000 respectively. Meanwhile, the average and median prices per square foot were up 8% and 6% to $228 and $219 respectively.
The average Days On Market rose marginally from 95 days to 126 days while the median rose from 80 days to 88 days.
The average and median sales price to list price ratio stayed steady at about 97%-98%.
Although this is all great news for the market, the most impressive market stat is the extremely low level of home inventory. Couple this with a 33% jump in sales over last year, and we have a very strong market, suggesting that prices should rise significantly moving forward.
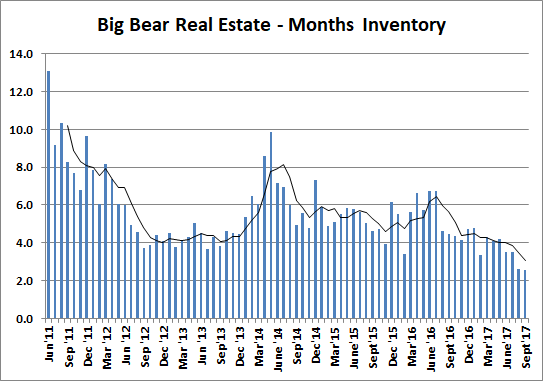
Take a look at the figure below showing months of inventory. This is derived by dividing the number of listings in a month divided by the number of sales. Theoretically, this shows how many months it would take to sell all the current listings if no new listings were to come on the market and if the sales rate were to remain the same. Keep in mind that in a normal market, you will find four to six months of inventory.
Couple the incredibly low inventory with increased sales along with mortgages hovering near historical lows and the economy the best it's been in over a decade, and I would expect the market to experience even greater price gains moving forward.