Pursuant to yesterday's post regarding Big Bear home inventory, half of the equation in figuring out months of inventory is the number of sales. (Listings per month divided by sales per month = months of inventory.)
Let's take a look at the history of Big Bear home sales going back to the bottom of the market back in 2011.
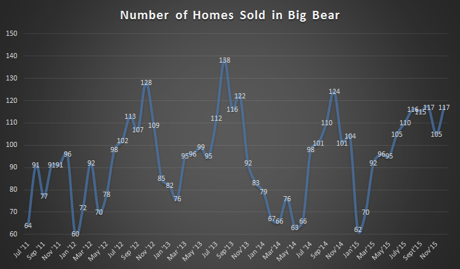
Looking at the graph, you can see a few trends.
First, you'll note that Big Bear home sales tend to peak in late summer and early autumn annually. Keep in mind that this data represents the sale date which typically comes 45 days after an offer was accepted. So people are looking and making offers closer to mid-summer and closing in the early autumn months.
In taking a closer look at the last few years of sales, you can see that instead of a sharp spike in Big Bear home sales in the summer, that the trend appears to be slowly rolling into a more evenly spread out distribution of sales. I would attribute this to Big Bear's shift towards becoming a more Four Season Mountain Resort. I also think the purchase of the local ski resorts by Mammoth Mountain investors led to more speculation than usual this year.
Regardless, Big Bear home sales this past year were up 12.5% over the previous year. So long as the number of Big Bear homes for sale stays relatively low, we will likely see strong growth and continued price appreciation throughout the year.