A May-To-May Comparison
Although May 2015 saw an increase in the number of Big Bear homes sold, prices seemed to flatten and even slide in the last month of our spring shoulder season.
Big Bear home sales rose 44% this May as compared to May of 2014 up to 91 closings. But the average and median home prices fell 7% and 1% to $295,485 and $215,000 respectively. Meanwhile, the average price per square foot fell 7% and the median price per square foot stayed even at $186 and $178.
Days on market continued to creep higher with the average Big Bear home being on the market 109 days this May before selling as compared to 94 days last May.
A Year-To-Date Comparison
Even with May's dip, the Big Bear real estate market has fared well in 2015.
Sales are up 17% over last year through May while the average and median price of Big Bear homes has risen 5% and 18% to $289,142 and $224,450 respectively. The average and median price per square foot of Big Bear homes having sold in 2015 is 3% and 5% higher than in 2014 at $188 and $180.
The days on market has risen from 106 days in 2014 to 121 so far in 2015. Hopefully we will see this number come down as our busy Big Bear home buying season kicks into gear next month.
Summer Sales Fever
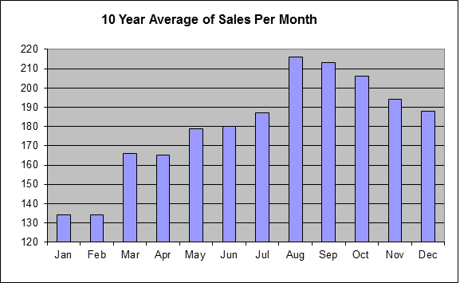
Traditionally, summer kicks off Big Bear real estate's busy season. Referencing the graph below showing a 10 year average of home closings per month, you'll see how July begins the six busiest months of the year for home sales. Although inventory usually rises into August, home sales should outpace new listings bringing down the days on market and overall inventory numbers heading into year's end. I have no reason to expect the trend to be any different this year as the market continues its march back to peak prices!