Your Big Bear Lakefront Real Estate Blog

An up-to-date resource for lakefront market reports, news, and infomation...

Dec. 20, 2019

Big Bear Holiday Update - 2019

Some quick updates, notes, and tips for the upcoming Holiday Week...


WEATHER

Following our HUGE Thanksgiving storm, mother nature has more snow for us over Christmas week. Here are the current snow totals. Keep in mind that the current forecast might change over the next few days. 

Monday: 3-5 inches

Tuesday: 1 inch

Wednesday: 2-6 inches

Thursday: 1-3 inches

Unlike Thanksgiving, it is nice that this storm is spread out over several days which should make travel and shoveling much easier. Again, keep an eye on the weather as it very well might change. Other than the usual weather websites, you might want to check out our local weatherman's report at www.BensWeather.com .

Also keep in mind that daytime temps will only be in the 30s next week. So bring your cold weather gear!


SKIING & SNOWBOARDING

The ski resorts have been adding to our Thanksgiving snow by making snow during most days and every night this week. Most runs are currently open and I would expect even more to be open if the expected snow arrives next week.

Conditions should be incredible!

If you want to check out current conditions, here's the live cam from Snow Summit:

 https://www.bigbearmountainresort.com/winter/mountain-information/web-cams/summit-base-cam

(You can also use the live cam to see how long the lift lines are too before deciding whether to head to the slopes!)

It is well worth waking up VERY early and getting to the slopes before the madness begins. Christmas week is one of busiest times of the year and it's well worth beating the crowds to the slopes.

HOT TIP: If you have someone who can drop you off at the slopes, DO IT! Parking lots will be full well before the slopes open. Use back roads to get less trafficked and closer drop off locations to the resorts. For example, here's the one I personally use to get to Snow Summit. There are similar routes approaching from the west as well.


DRIVING

Remember that there are 3 ways into Big Bear. 

THE FRONT WAY - the 210 to 330 to 18, over the Dam approaching Big Bear from the west. This is always the busiest way into Big Bear and usually the quickest when there is no traffic.

THE BACK WAY - the 10 to the 38 through Redlands and through Angeles Oaks. Less traveled but a little longer.

THE LUCERNE WAY - take the 15 over Cajon Pass, through Vicorville/Apple Valley. Considerably longer but MUCH less traffic and road conditions are usually less of a concern due to less snowfall on the high desert side of the valley.

Use websites like Google Maps, Cal Trans, Waze, etc. before heading up the hill to decide which way is best!

BRING YOUR CHAINS! Even if you have 4WD or AWD, always carry chains in your car. 

HOT TIP: Locals always have an extra jacket, set of gloves, winter hat, water, food etc. in their cars during winter time. You never know when you might get stuck!


ENTERTAINMENT

Do not miss the Village lights over the Holidays, especially if it's snowing. There's nothing more Big Bear than walking through the Village with all the trees lit up, snow falling, and smiling visitors abound. Grab some hot cocoa at Copper Q and sit by the fire pit. (Or have a Hot Toddy, Irish Coffee, or Brandy by the fire pit at Oakside Restaurant if that's more your speed.) Don't miss the Christmas Tree at the Village center at the corner of Village Drive and Pine Knot!

Here's something different to do! Believe it or not, we have some very talented local actors in Big Bear. Some of them put on the comedy event of the year with their CHRISTMAS CAROLE ASKEW performance. Always hilarious, for kids and adults alike. Performances the Friday and Saturday night (20th and 21st) at 7:30  and Matinee this Sunday the 22nd at 2:30 and City Hall. More info below.

https://www.citybigbearlake.com/index.php/city-departments/calendar/eventdetail/439/-/a-christmas-carol-askew-presented-by-the-big-bear-theatre-project


FOOD AND EATING

I usually recommend a few restaurants. But per a client's request, I will name my TOP 5 FOOD DISHES in Big Bear! It's really hard to rank these, so in no particular order.....

1) The Kracken Bowl at The Local Tropicali - https://www.osotropicali.com/

2) Lamb Masala at Himilayan Restaurant - http://www.himalayanbigbear.com/

3) Avocado Bomb at Big Bear Lake Brewing Company - https://www.facebook.com/BigBearLakeBrewingCompany

4) Roasted Caesar Salad with Grilled Salmon at 572 Social - http://www.572social.com/

5) Turkey/Steak Sliders at Oakside - http://www.oaksiderestaurant.com/

DISCLAIMER: To each, their own! These recommendations are per my preferences. But you'd be hard pressed to find a local who would speak ill of any of my aforementioned culinary suggestions!

Also, if you are planning to eat ANYWHERE in Big Bear this week, MAKE RESERVATIONS IF POSSIBLE!


I really hope you get a chance to visit Big Bear this upcoming week. With snow on the way and our resorts in great condition, it should be a Holiday Week to remember!

Posted in Other
Dec. 2, 2019

Big Bear Real Estate Update - November 2019

SAME MONTH COMPARISON

Sales of Big Bear homes stayed steady while price measures rose this November in a same month comparison.

There were 100 Big Bear homes sold this November as compared to to 103 closings in November of 2018.

The average sale price rose 4% to $359,249 while the median sale price rose 13% to $317,500.

The average price per square foot rose 1% to $244 while the median price per square foot rose 3% to $242.

The average and median sales price to list price ratio stayed about the same at 98%.

The average days on market rose 6 days to 104 days and the median rose from 81 days to 86 days.


YEAR-TO-DATE COMPARISON

Sales of Big Bear homes are up 4% so far in 2019 with 1162 closings.

The average sales price is up 5% to $352,286 while the median sale price is up 4% to $300,000.

The average price per square foot is up 1% to $247 while the median price per square foot is up 2% to $241.

The average and median sales price to list price ratio is steady around 98%.

The average days on market rose 8 days to 98 days and the median rose 5 days to 68 days.


CURRENT MARKET INFLUENCES

Mortgage rates remain remarkably low at an average 3.68% for a 30 year fixed loan currently. This compares to an average 30 fixed rate of 4.81% at this time last year. These low rates should help continue to move the Big Bear real estate market forward through the new year.

Locally, we just received our biggest November snow storm in over 50 years. The 3 to 4 feet of snow our local resorts received should have a hugely positive impact on our local economy. More visitors to our valley means more interest in Big Bear real estate.

With the overall economy still strong, interest rates much lower than they were last year, and with Big Bear much more likely to have a busy winter season with our recent snow storm, it appears the Big Bear real estate market will continue to remain strong into 2020.


Posted in Market Reports
Nov. 15, 2019

A Quick Big Bear Lakefront Update

Having received many questions about the Big Bear real estate market recently, I thought I'd share the following for your information for your review. I hope you find it informative and insightful!
 
 
BIG BEAR LAKEFRONT SALES SURPASS 2018 TOTALS
With the holidays fast approaching, lakefront sales have remained steady. The figure below shows how we've already far surpassed last year's sales total with over a month still left in 2019.
Inline image

You will also note in the above and below figures that the two strongest years for Big Bear lakefront sales were two years when the lake levels rose significantly to a near full level.  
Inline image
Reviewing historical lakefront sales and lake levels, it stands to reason that this year's uptick in sales is due to the lake filling significantly last winter. Although the lake rose over 9 feet, it was remained over 9 feet from full. 
If we have a similar winter to last year's, our lake should be close to full come next summer and would further energize the lakefront real estate market.
DO LAKEFRONT SALES SLOW DURING THE WINTER SEASON?
Yes, the numbers below show that there are typically fewer sales in the first few months of the year. BUT.... the two highest priced lakefront sales this year went into escrow in January and February. So although sales may slow, there are always buyers interested in lakefronts. You never know when that one right buyer will come along for any particular property.
Inline image

As well, because many real estate agents and lakefront owners perceive the winter as a slower sales season, many sellers pull their listings off the market until the following spring. This results in fewer lakefronts on the market for buyers to choose from. This, too, gives lakefront sellers an advantage during the winter months.
In short, if you are a lakefront owner looking to sell your Big Bear waterfront property, don't dismiss the winter months as there are always lakefront home buyers out there looking for the right property that meets their wants and needs.
Nov. 8, 2019

Big Bear Real Estate - By The Numbers - October 2019

In an October same month comparison, Big Bear home sales were up and prices showed continued appreciation across all measures. 

Sales this October were 12% higher than last October with 137 closings. The average sale price this October was up 7% to $376,682 and the median was up 12% to $335,500. The average price per square foot rose 2% to $244 while the median price per square foot rose 3% to $242.

The average days on market was up slightly from 92 days to 107. The median sales price to list price ratio stayed steady at about 97.5%

Looking at the longer term year-to-date numbers (Jan. 1 through Oct. 31), we also see appreciation across the board.

Sales are up 7% this calendar year to 1013 closings. The average home price is up 4% to $354,700 while the median sales price rose 4% to $300,000. The average price per square foot gained 2% to $248 and the median price per square foot is up 3% to $243.

The average days on market is up slightly from 90 days to 98 days. The median sales price to list price ratio is about half a percent lower to 97.5%.

Heading into our winter months, it appears that we will end the year with across the board positive numbers. Sales are up, prices are up, and Big Bear's popularity seems to be increasing. The local resorts, purchased by Aspen/KSL Investors just a couple years ago, have continued to improve the local ski areas and have brought several high-profile events to the valley. With increased visitorship, we have seen several new shops and restaurants open recently and significant city improvements made to The Village area. With Big Bear's increased popularity and with mortgage rates still near historic lows, the future is looking bright for Big Bear real estate.

Posted in Market Reports
Oct. 9, 2019

Big Bear Real Estate Update - 3rd Quarter 2019

Hard to believe that we're already in the 4th quarter of 2019! Let's take a look at the first three quarters and see how the Big Bear real estate market compares to last year.

YEAR-TO-DATE COMPARISON

On a year-to-date comparison, through the first three quarters of 2019 we have seen a 6% increase in Big Bear home sales with 825 closings last year as compared to 875 this year.

All four major price measures showed appreciation as well. 

The average and median sales prices were up 4% and 2% to $350,099 and $295,000 respectively. Meanwhile, the average and median price per square foot measures rose 3% and 3.5% to $249 and $245 respectively.

The average days on market rose slightly from 89 to 97 days while the median days on market rose from 62 to 64 days. The average sales price to list price ratio stayed basically the same around 98%.

3RD QUARTER COMPARISON

When we compare just the 3rd quarter of 2019 to the third quarter of this year, we see even greater gains.

Sales were up 8% in the 3rd quarter comparison, while the average and median sales prices rose 8% and 3% to $348,254 and $292,000 respectively. The average and median prices per square foot rose 3% and 4% to $252 and $245.

Days on Market rose slightly from 84 days to 88 days while the median rose from 56 to 64 days. The average sales price to list price ratio stayed constant at 98%.

SUMMARY

Overall, sales are up and prices have continued to appreciate in 2019. Mortgage rates are fantastic, still well below the 4% mark for most borrowers. Locally, the ski resorts continue to make on-site improvements while the Big Bear Valley continues to see several municipal improvement projects moving forward. Heading into the final stretch of 2019, I am optimistic we will end our year with our 8th consecutive year of home price appreciation. 


Posted in Market Reports
July 25, 2019

2019 Big Bear Lakefront Update

With summer in full swing and the first big heatwave of the year expected to hit the Southland this weekend, I figured now is as good as a time as any to check in on the Big Bear lakefront real estate market.

After 2018 ended up as the worst year for lakefront sales since the Big Bear MLS began keeping electronic records in 2002, with the lake filling up over 9 feet due to a wet and snowy winter, expectations were that the lakefront market would bounce back significantly.

So let's take a look...

Let's start with sales.


Note that so far in 2019, we have almost matched the number of lakefront sales from all of last year. Looking at the figure below, with what are typically our busiest months for lakefront sales still ahead, I would expect to see sales at least double before year's end. 

So sales have bounced back to a more normal level, but not a remarkable level (as of yet) like we saw in 2005 when the lake filled up over 15 feet and 2012 when the lake was full to the point that water was spilling over the top of the dam.

Now let's take a look at Big Bear lakefront home values.

While 2018 was a year when mostly smaller, shallow-water homes sold at a huge discount as sellers feared another dry winter would negatively affect their home values further, we've seen prices bump back up to a more typical range this year. 2019 has seen a couple 2M dollar plus sales already whereas the highest price sale in 2018 was only $1,125,000. So we're back to seeing a more normal distribution of sales among price ranges resulting in more accurate average and median price numbers.

Price per square foot measures of lakefront homes has remained constant in the mid-$400 level, typical of the last few years. Not much change here which suggests that although the average and median sales prices fell in 2018, lakefront home values have actually stayed relatively stable.

Next, let's look at how long it is taking lakefront homes to sell.

Another bright spot this year is that lakefronts are spending less time on market before selling. Interestingly, the average number of days on market of currently listed properties is 255. This supports the belief that lakefront homes that are priced right are selling quickly while others are spending much longer on market, with many others never selling at all..

Taking into account these current market conditions, Big Bear lakefronts have seen the bounce back we expected. Up to this point, it's been a good recovery, but not a spectacular one. With summer hitting its stride and with what are typically our busiest months ahead of us for lakefront sales, I remain optimistic that the lakefront market will go from good to great before year's end.


July 10, 2019

Second Quarter Big Bear Homes Sales Show Continuing Strong Market

Because the Big Bear Real Estate market is a relatively small one, I often look to the quarterly sales figures for more accurate guidance as to market conditions. Monthly sales figures can be deceptive as there are sometimes too few sales to get a true picture of the market conditions. Just a few very high end or low end sales can sway the data significantly. Looking at quarterly numbers give us a larger sample size and more relevant numbers to work with.

On that note, here's an historical look at the number of Big Bear homes that have sold each quarter.

Big Bear Homes Sold

You can see from this figure how sales trend up each summer and drop into the slower winter months. Comparing the second quarter sales of this year to the last 5 years, you will see that although 2017 was higher and 2018 was lower, over time, we are right about average over the past 5 years. So sales remain stable.

Here's a look at the average and median sales price and price per square foot of Big Bear homes.

Big Bear home prices 

big bear homes price per square foot

Although the price measures of Big Bear homes trend up and down regularly over time, the overall trend of both sales prices and the price per square foot measures are still moving in the positive direction. Prices are continuing to appreciate well into their 8th year of consistent gains.

Here's a look at the number of listings and months of inventory.

Big Bear hone listings

Not unlike sales, Big Bear home listings trend upward in the summer and hit their bottom in the winter months. Currently, we have slightly fewer listings than we had last year and far fewer than the at the market's bottom in 2011. 

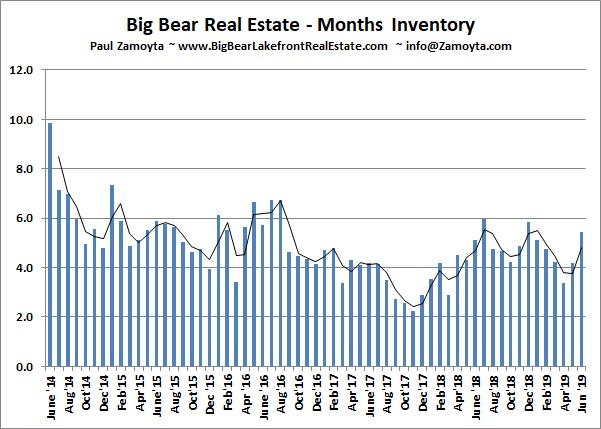
Big Bear home months of inventory

This figure shows Months of Inventory which is derived by dividing the number of listings for a specific month by the number of sales for that month. It results in a theoretical number of months it would take for every listing to sell if sales remained constant and if no new listings came on the market. 

A typical market has about 5 to 6 months of inventory, so the Big Bear real estate market is at a healthy balance between a buyer's market and seller's market currently.

Lastly, let's look at mortgage interest rates.

mortgage rates

This figure shows the significant rise in interest rates we saw from late 2017 to the end of 2018. 2019 has seen a welcomed drop in rates from almost 5% to solidly under 4%. This 1%+ drop in rates actually translates into an almost 10% gain in a buyer's purchase power. Near it's historical low, buyers are in a unique position to take advantage of these amazing interest rates.

With Big Bear home sales steady, home values continuing to appreciate, and near record low mortgage rates, the Big Bear real estate market continues to be bullish. Although there has been a lot of talk about uncertainty in all financial markets, there are no indicators that Big Bear's real estate market is anything but solid through the foreseeable future.

Posted in Market Reports
May 8, 2019

April 2019 Year-To-Date Big Bear Real Estate Numbers Show Continued Appreciation and Strong Market Conditions

Big Bear home sales are up 18% so far in 2019 with 364 closing through the end of April. This uptick in sales may be attributed to lower interest rates and a busy winter season due to above average snowfall and the subsequent 9 foot rise in Big Bear Lake's water level.

The average sale price of Big Bear homes has also risen 1% to $353,645 while the median sale price is up 2% to $295,000.

The average price per square foot of sold Big Bear homes this year is up 3% to $247 and the median price per square foot is up 5% to $240.

As well, Big Bear homes are selling faster this year with the average Days On Market dropping from 104 days to 99 days and the median days on market dropping from 99 days to 67 days.

Heading into our busiest time of year for home sales, the inventory of homes for sale remains about 10% lower than last year with there currently being 400 home listings in Big Bear.

With increased sales and fewer listings, the law of supply and demand suggests that prices will continue to rise. Additionally, Big Bear Lake's water levels are at their highest point in the past 5 years, so I would expect buyer demand to become even stronger as visitors escape to Big Bear for their summer vacations. As a result, I expect the Big Bear real estate market to remain strong through the foreseeable future fueled by Big Bear's increasing popularity, good economic conditions, and historically low interest rates. 


Posted in Market Reports
April 3, 2019

March 2019 Big Bear Real Estate Market Report

March sales numbers show mixed signs while the year-to-date numbers suggest a stable market with continued price appreciation.

After two months of increased sales, March 2019 saw a 15% dip in sales as compared to sales from last March. Although sales slowed, the average sales price was up 6.5% and the median rose 3.2% this March to $379,115 and $310,000 respectively. Meanwhile, the average and median prices per square foot dropped slightly sliding 3% and 2% to $239 and $236 respectively.

The average Days On Market rose slightly from 96 days to 114 days while the median rose from 54 days to 94 days. The sales price to list price ratio dropped over 1% from 98.36% to 97.22%.

On a year-to-date comparison, we have seen Big Bear home sales stay stable so far this year, dropping only 1%. Meanwhile, the average and median sales prices are up 5% and 1% to $367,536 and $299,000 respectively. The average and median prices per square foot are up 1.5% and 2.5% to $243 and $235 respectively.

The Days On Market measure has risen slightly from 99 days to 106 days while the median rose from 71 days to 85 days.

As the figure below shows, 30 year mortgage rates have settled down close to 4% after almost hitting 5% last November. With rates dropping to the 4% benchmark, I would expect the market to remain strong through the foreseeable future.

30 year mortgage rates

From a local perspective, Big Bear Lake's water level rose almost 9 feet this winter and the new ownership of our local mountain resorts has continued to develop the resort area adding more trails, outdoor activities, and summer programs. These factors are likely to continue the increased visitorship that we've seen over the last few summers. And more visitors to Big Bear means more prospective home buyers to the Big Bear Valley!


Posted in Market Reports
March 7, 2019

February 2019 Big Bear Real Estate Numbers

Sales of Big Bear homes were up almost 10% this February with 72 closings as compared to 66 closings in February 2018.

We saw conflicting direction on prices with the average sale price increasing 10% to $372,421 while the median sale price went down 10% to $297,500. We saw more concurrence with the price per square foot measures with the average price per square foot rising 2% to $245 and the median price per square foot rising 10% to $246.

The average days on market stayed the same at 104 while the average sale price to list price ratio dropped slightly from 98% to 97%.

Looking at the Big Bear real estate market from a year-to-date perspective, sales are up 7% so far in 2019 with 150 Big Bear home sales in the books for this year. This is a welcomed change from the 20% drop in sales we saw overall last year! 

As well, prices are up across the board with the average and median sales prices rising 5.5% and 5% to $363,130 and $293,500 respectively. The average and median prices per square foot rose as well by 5% and 4% to $245 and $234 respectively.

With a strong start to 2019, mortgage rates settling back down to the low 4% range, and with this year's particularly snowy and wet winter not only bringing a record number of visitors to our valley, but also bringing the lake's water levels up over 6 feet so far, I would imagine we will continue to see steady growth in the Big Bear real estate market through the foreseeable future.

Posted in Market Reports