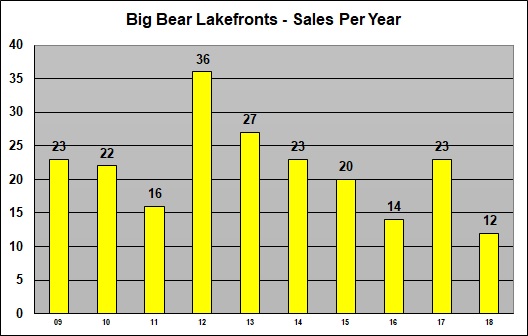
With Big Bear Lake's water levels at a 50-year low, lakefront sales were exceptionally slow in 2018 with only 12 closings - a record low since at least 2002 when electronic records started being kept.
For an overall perspective of the 2018 Lakefront market, let's start with an historical perspective of Big Bear Lake's water levels over the past 50 years.

Although Big Bear Lake's water levels seem to have a somewhat predictable pattern of ups and downs over the last 50 years, prospective lakefront buyers were more hesitant than usual to commit to purchasing last year.
The result of this buyer hesitance was a significant slowdown in sales. Below you can see that 2018 was the slowest year for lakefront sales in over a decade.

To access e-flyers to all the lakefront homes that sold in 2018, click here: 2018 SOLD LAKEFRONTS
Not unexpectedly, the slowdown in sales meant the average days on market increased, with it taking 226 days on average for the lakefronts that closed in 2018 to sell.

Lastly, there were several economic reasons for the slowdown in sales. The new tax laws limited the deductions on property tax and mortgage interest. As well, mortgage interest rates on a 30-year fixed loan rose significantly from a 2016 low of about 3.5% to a height of almost 5% in 2018. Fortunately, the Federal Reserve did not raise rates in January and mortgage rates have actually decreased once again to about 4.5%. That being said, higher interest rates usually have a negative effect on sales.
Due to the lack of sales, the average and median sales price numbers plummeted this past year. However, in taking a closer look at the 12 individual lakefront sales, you'll see this drop off can be explained and is not indicative of overall lakefront home values. Take a look below at the historical record of lakefront prices.

On a whole, the precipitous drop in the average and median sales prices might suggest that lakefronts in general lost nearly half their values last year. But when you look at the individual lakefront sales more closely, you see that the majority of sales were smaller, less expensive, and generally shallow water homes that were largely affected by the lake levels.
Many of these lakefronts had docks that were beached and would need to see a substantial rise in the lake's water levels before offering lake access. These sales often represented sellers motivated to get out of the market quickly after spending some time listed at higher prices, but ultimately deciding to sell at a discount. On the other side of these transactions were buyers looking to invest in anticipation of significant price appreciation when the lake's water level eventually comes back up.
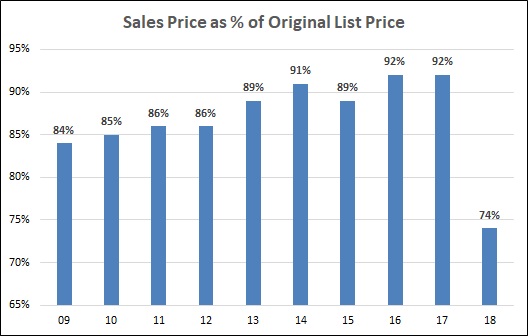
To see the extent to which lakefront sellers lowered their list prices in order to get sold, take a look at the figure below showing the sales price to original list price ratio.

In 2018, lakefront home owners came down off their original list price an unprecedented 26% to arrive at their eventual negotiated sales price. As one would expect, these motivated sellers were another factor that contributed to the unusually low average and median sales prices in 2018.
Lastly, 2018 saw a significant slow down in higher-end home sales which further skewed the average and median sales price numbers lower. The most expensive of the 12 homes to sell in 2018 was sold at $1,125,000.
In 2017, there were 10 sales over this amount, including three sales over $2M and two sales over $3M. Some of the absence of high-end lakefront sales was due to the lake's water levels, but there was also a lack of competitively priced high-end lakefront homes listed for sale as well. Regardless, fewer high end sales resulted in a much lower average sale price.
Ultimately, I feel the price per square foot measure below offers a better perspective of lakefront home values.

From a price per square foot perspective, you can see a relatively stable trend around $450/sf over the past five years. With the exception of shallow water lakefronts, I think that lakefront home values stayed relatively constant in 2018 in light of slowing sales.
In summary, sales of Big Bear lakefronts lagged in 2018. This can be attributed to Big Bear Lake's water levels hitting a 50-year low, rising interest rates, and limitation on mortgage and property tax deductions.
The average and median sales prices dropped almost 50%, but this can be simply explained by many smaller, shallow water lakefronts selling at a discount price along with a lack of sales in the higher end price ranges. More accurately, the median and average price per square foot of lakefronts stayed relatively constant at about $450 per square foot.
Looking forward, guessing what the market will do in 2019 is difficult to say the least. From a buyer's perspective, the slowdown in sales may be an opportunity to purchase a lakefront with sellers pricing their homes more aggressively in an uncertain market before the market turns upwards again. Conversely, current lakefront owners may have the opportunity to realize the gains of the past 8 years by selling at what might be the market's peak.
Regardless of market forces, we have had one of our busier winter seasons as more and more visitors are discovering what a special place Big Bear is. With the continuing development of our local resorts and village area, Big Bear's appeal continues to grow. This bodes well for Big Bear real estate through the near future and hopefully well beyond!
Paul Zamoyta ~ 909.557.8285 ~ Info@Zamoyta.com

No other agent has represented more buyers or sellers of
Big Bear lakefront homes in the past 5 years.