A common question I hear from both prospective buyers and sellers is about when the best time to buy and/or sell might be. The answer to that question lies in comparing supply and demand by looking at the rate at which homes are sold and comparing that to the number of homes that are for sale at that point in time.
Let me explain. Take a look at the figure below showing a 10 year average of sales per month.
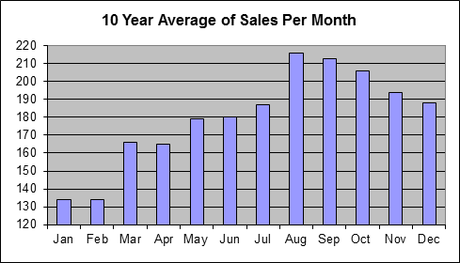
As you can see, the slowest months for Big Bear real estate are in January and February. From there, sales rise until the summer's peak in August. Late summer home interest starts mixing with buyers looking towards the upcoming ski season throughout the fall. This keeps the end of the year taper still a relatively busy time for sales.
Looking solely at this graph, one would think that buyers would have an advantage in the early spring as sellers don't have many customers looking at their properties. But the other side of the equation are the listings, the supply side.
Take a look at the figure below showing the number of listings on the market over the last year.
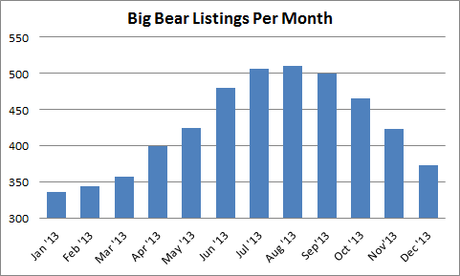
Hopefully, the first thing you noticed was that this graph looks remarkably similar to the number of home sales graph above. January and February have the fewest number of listings. Listings peak over the summer and taper through the fall.
So when when the number of listings are low, so are the number of sales. When sales are high, the inventory is high also. Consequently, the fact that supply and demand stays relatively the same throughout the year, it is reasonable to conclude that there is no obvious time of year that gives buyers or sellers a particularly good advantage for buying or selling.