A quick look at some updated Big Bear real estate quarterly graphs...
Taking a quarterly look at home prices, we see a dip in prices in the second quarter of this year, but the overall trend shows continued home value improvement. Since 2011, we have seen Big Bear home values increase consistently.

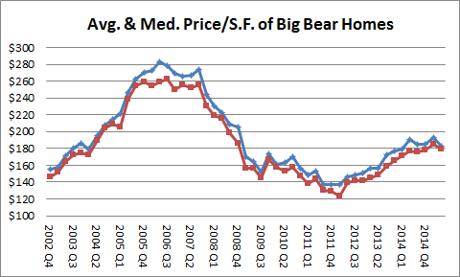
We see similar increases on a price per square foot basis as shown in the figure below.
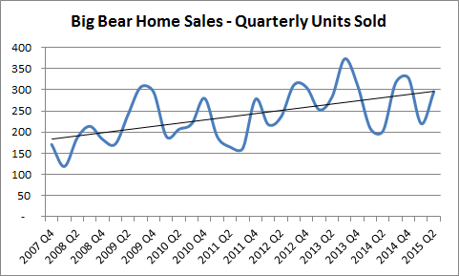
Since 2007, we have seen the number of Big Bear homes sold trend upward as buyer demand has increased steadily.
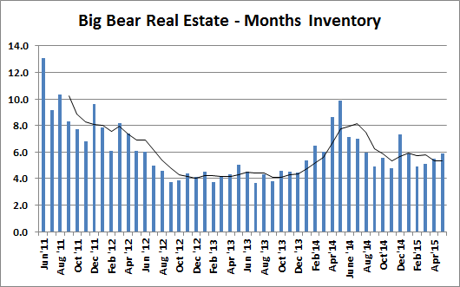
After record highs in Months Of Inventory in 2011, the market has stabilized close to a more normal 6 months of inventory.
Overall. the market remains solid. We are heading into what is traditionally our two busiest quarters of the year. I would expect the market to show continued improvement through 2015.