Your Big Bear Lakefront Real Estate Blog

An up-to-date resource for lakefront market reports, news, and infomation...

Dec. 12, 2022

Big Bear Real Estate Market Update - November 2022

Real estate sales in Big Bear dropped precipitously this November with only 56 closings compared to 164 last November. But there are reasons this drop occurred. The first reason was the forest fire we had in September which closed the valley to visitors. The second reason was the pending November vote on Measure O which would limit vacation rentals.

With fewer buyers in Big Bear due to the fire and with many buyers choosing to await the outcome of the Measure O vote before buying (it did NOT pass and vacation rentals are continuing to operate as usual), and being that a typical escrow period is about 45 days, it makes since that November's Big Bear home sales would be substantially lower.

That being said, here are the sales numbers comparing November 2021 Big Bear home sales to those of November 2022.

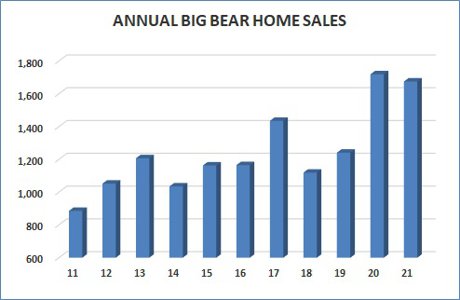
The number of Big Bear homes sold dropped from 164 to 56 representing a decline of about 66%.

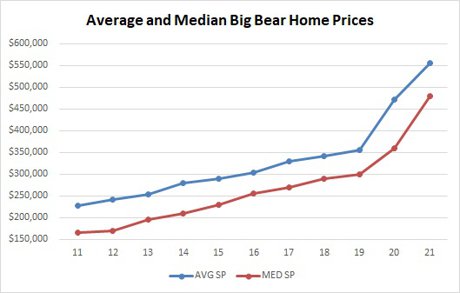
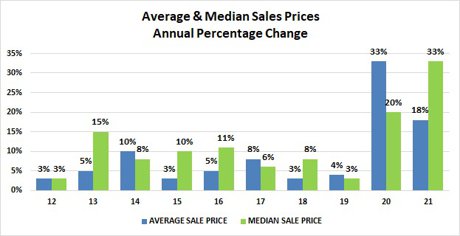
The Average sale price dropped from $571,654 to $522,588 representing a drop of about 9%.

The median sale price dropped from $500,000 to $415,000 representing a drop of about 17%.

The average sales price to list price ratio dropped from 101% to 98%.

The average number of days a Big Bear home was listed before selling rose from 58 days to 82 days.

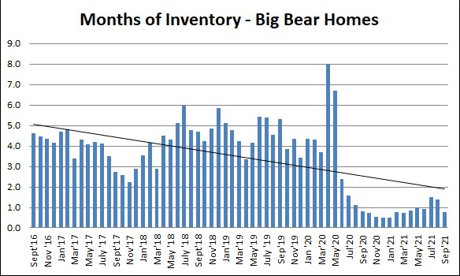
There were 56 homes listed for sale in the Big Bear MLS around this time last year. Currently there are 237. That is an increase in home inventory of about 400%! But if you compare the current 237 listings to the 402 listings we had in December 2019, our most recent pre-covid year, home inventory is still lower than what one would expect in a normal market.

Interest rates have actually started simmering down dropping to an average 6.33% for a 30 year fixed compared to their height a few weeks ago at %7.08. But rates are still 3.22% higher than at this time last year.

Looking forward to writing my YEAR IN REVIEW summary in just a few weeks. Until then, HAPPY HOLIDAYS!


Posted in Market Reports
May 16, 2022

Big Bear Real Estate Stat of the Day

Lots of people have been asking me about what the inventory of homes is doing. Here's a rundown of the current number of listings and how that compares to the previous few years:

April 2022 - 195 single family homes listed for sale

April 2021 - 122 single family homes listed for sale

April 2020 - (beginning of pandemic) 360 single family homes listed for sale

April 2019 - (pre-pandemic) 361 single family homes listed for sale

So you can see that the inventory of homes is increasing, but we are no where near what inventory was in a "normal" year.

Will keep you updated on if and how this trend continues to change moving forward!


March 7, 2022

2021 YEAR END - Big Bear Real Estate Market Report

The market didn't slow down much in 2021 where demand for Big Bear homes was at all-time highs while the supply of homes fell significantly. This high demand and low supply in the Big Bear real estate market pushed prices even higher after their 2020 record run.

The following graphs quantify this narrative putting the Big Bear real estate market's movement over the past couple years into a 10 year perspective.


The past two years are the two highest years on record for Big Bear home sales. Demand was at an all time high.


While demand stay high, the number of Big Bear homes for sale hovered near record lows. The supply of homes currently on the market still remains remarkably low.


The high demand and low supply pushed Big Bear home prices to all-time highs with record price jumps over the last two years.


The price per square foot of Big Bear homes followed suit with record increases as well with 2021 ending at an all-time high of almost $400/sf.

With the supply and demand dynamic so unbalanced right now, prices seem poised to continue to rise for the foreseeable future. The inventory of homes would have to triple or quadruple to see a more typical balanced market, but there has been no evidence suggesting this will happen anytime soon. 


Posted in Market Reports
Dec. 14, 2021

Big Bear Real Estate Report - November 2021 Sales Numbers

Comparing the number of Big Bear home sales from last November to those from this November, sales fell 21% to 160 closings. Although a drop in sales usually indicates a cooling market, that is NOT the case here. Sales have slowed due to the unprecedented lack of homes for sale leaving few choices for the multitude of buyers looking to purchase.

Home inventory is at an all-time low with there currently being only 63 Big Bear homes for sale! In comparison, in December of pre-covid 2019, there were 402 Big Bear homes for sale in mid-December. So long as inventory stays low, sales will remain slower due to buyers not being able to find the home that fits their wants and needs. But prices, on the other hand, are likely to continue to rise as there will be more competition among buyers for those few properties that are on the market.

Continuing our comparison of last November's sales numbers to this November's, the average and median sales prices rose 8% and 24% to $568,289 and $500,000 respectively. The average and median prices per square foot rose 29% and 25% to $391 and $378 respectively.

Big Bear home sales continued November 2020's trend of selling for slightly over full price on average while the average Days On Market before selling fell from 75 days last year to just 58 days this year.

With mortgage rates staying in the low to mid 3% range and with home inventory so remarkably low, the Big Bear real estate market remains remarkably strong and is likely to remain so throughout the foreseeable future.

Paul Zamoyta ~ info@Zamoyta.com ~ 909.557.8285


Posted in Market Reports
Nov. 1, 2021

Big Bear Real Estate - Third Quarter 2021

Third quarter Big Bear homes prices continued to show significant appreciation for the 4th consecutive quarter reaching all-time highs as shown by the figure below.

Although prices continue to rise, sales are cooling from last year's booming third quarter.

One might think that slowing sales may be a sign of market weakness. But to the contrary, sales have slowed due to lack of homes for sale as evidenced by the figure below showing the remarkably low current inventory of listings.

With less than one month's inventory of Big Bear Homes for sale and with buyers paying 100% of list price on average in the third quarter, there's little doubt that the Big Bear real estate market is still bullish. As such, I would expect to see home prices continue to rise through the foreseeable future and sales to pick up again once more inventory eventually hits the market.


Posted in Market Reports
Oct. 12, 2021

Big Bear Real Estate Numbers - September 2021

Comparing Big Bear home sales this September to those of last September, we continued to see a slow down in purchases with 140 closings this year compared to 251 closings last year. Although this 44% drop in sales may seem significant, we are still well above the 106 home sales we had in 2019, our last "normal" year.

Although sales are slowing, price measures are still rising year over year. 

The average and median sales prices of Big Bear homes rose 14% and 20% to $606,681 and $489,950 respectively. The average and median price per square foot also rose 36% and 42% to $398 and $387 respectively.

The average and median sale price to list price ratios stayed steady around 101% and 100% while the average and median days on market were slightly lower at 54 days and 43 days.

Perhaps the biggest market force driving Big Bear real estate currently is the incredibly low inventory of Big Bear homes for sale. There are currently only 136 single family residences listed in the entire valley. Based on last month's sales rate of 140 closings, that leaves us with less than one month of inventory!

So long as the inventory of homes stays this low, even in light of slowing sales, Big Bear home prices should continue to appreciate through the foreseeable future. 


Posted in Market Reports
Sept. 22, 2021

Big Bear Real Estate - August 2021 Numbers

Sales of big bear homes continued to simmer down in August but price measures still showed impressive year over year appreciation.

When comparing Big Bear home sales from August of last year to August of this year, the average and median sales prices of Big Bear homes rose 21% and 22% to $556,507 and $466,250 respectively.

Comparing average and median price per square foot measures, there was a 41% and 36% increase year over year to $388 and $372 respectively.

Homes were sold at 100.69% of list price on average this year, up from 99.33% last August. Meanwhile, Big Bear homes sold in just 50 days on average in August, which is less than half of 2020's average of 103 days.

Looking at the inventory of Big Bear homes for sale, there are still remarkably few homes listed. Last August we had about 250 homes for sale whereas this August we averaged about 225 listings.

In summary, sales are slowing after last years unprecedented boom in activity. Although the demand side of the equation has been softening, the supply side still remains low with extremely few homes listed for sale. Considering this along with the incredibly low days on market numbers we're seeing, the overall market is still in a very strong position.


Posted in Market Reports
Aug. 9, 2021

July 2021 - Big Bear Real Estate Market Update

Comparing July 2020's real estate numbers to those of July 2021, Big Bear home sales unexpectedly dropped by about 1/3rd to 131 closings. Although sales slowed this July, they were still well above the 105 closings we saw in 2019.

When we compare price measures from July 2020 to July 2021, we get a good sense of how much the market has appreciated over the past year.

The average and median sales prices rose 43% and 41% to $649,576 and $455,702 respectively. Meanwhile, the average and median price per square foot measures rose 38% and 46% respectively to $391 and $378 respectively.

The average sale price to list price ratio rose from 99% last July to 102% this July, with Big Bear homes continuing to sell for over full price on average.

The average days on market almost halved from 101 days in July 2020 to just 51 days in 2021.

Looking at the number of Big Bear homes for sale, we currently have 201 single family home listings on the market. Last August, we had approximately 250 listings while in August of 2019 we had 570.

Overall, the Big Bear real estate market continues to remain quite strong. Although sales dipped this July, they are significantly higher than they were in 2019, our most recent "normal year". With so few Big Bear homes listed for sale, with interest rates still near historic lows, and buyer demand remaining relatively high, it looks like the Big Bear real estate market will continue to fair well through the foreseeable future.


Posted in Market Reports
Aug. 2, 2021

Big Bear Real Estate - Mid Year Review

With the first half of the year coming to a close, I thought it would be interesting to compare the first 6 months of 2020, when the pandemic reared its ugly head, to the first 6 months of 2021, when Big Bear real estate saw record high sales and sale prices.

Here are the numbers comparing the first 6 months of 2020 to that same time period in 2021:

The average sale price of Big Bear homes rose 39% to $532,238.

The median sale price of Big Bear homes rose 50% to $450,000.

The average price per square foot was up 44% to $374.

The median price per square foot was up 44% to $360.

The average sales price to list price ratio rose from 98% to 104%.

The average Days On Market dropped from 113 days to get a home sold to just 48 days, a drop of 60%.

Lastly, comparing home inventory, we had 321 Big Bear homes for sale in June of 2020 while this June we had only 165 Big Bear homes for sale, a 49% drop.

These numbers are beyond anything that anyone could have imagined at the time the pandemic arrived. I think it is safe to say that these price increases and the speed at which they happened were unprecedented.

Understandably, many prognosticators are concerned about a real estate bubble adopting a "what goes up must come down" stance. But with so many well qualified purchasers over the last year putting significant down payments on their homes, and with many others paying all cash, I think a "bubble burst" is unlikely. 

Regardless, with the current home inventory astonishingly low, the Big Bear real estate market seems to be in a very strong position through the foreseeable future.

Posted in Market Reports
April 6, 2021

Big Bear Real Estate - 1st Quarter Comparison

2021's first quarter numbers are in for the Big Bear real estate market. Let's compare them to the first quarter of 2020's numbers to see how much things have changed over the incredibly busy year we've had. This should give us a good idea of how much the market has appreciated as we are comparing the 3 months in which homes went into escrow before the covid lockdown last year to the same three months this year during the recovery period.

Sales of Big Bear homes were up 36% in the first quarter of 2021 with 361 closings.

The average and median sales prices were up 31% and 34% to $509,913 and $425,000 respectively.

The average and median prices per square foot both rose 42%.

The average sales-price-to-list-price ratio went from 97.5% in 2020 to 104.5% in 2021. This means that homes sold for almost 5% over list price on average during 2021's first quarter.

The median days on market dropped from 93 days in 2020 to 39 days on 2021.

Home inventory currently stands at 111 single family homes listed in the Big Bear MLS. Last year there were approximately 360 at this time.

Not only do these numbers show the record year we had for Big Bear real estate in 2020, but with sales still 36% higher than this time last year and with inventory about 70% lower than it was last year, the supply and demand dynamic suggests the market is still in a very strong position! 

I would expect to see prices continue to appreciate until sales slow down and more listings come on the market. But as of now, there's really no sign things are slowing down.

Paul Zamoyta ~ Info@Zamoyta.com ~ 909.557.8285


Posted in Market Reports