Your Big Bear Lakefront Real Estate Blog

An up-to-date resource for lakefront market reports, news, and infomation...

Feb. 3, 2021

January 2021 Big Bear Real Estate Market Report

Here's a quick update comparing the Big Bear home sales numbers from January 2020 to January 2021.

Sales are up 60% this January to 129 Big Bear homes sold.

The average sale price of Big Bear homes is up 19% to $453,876 while the median sale price is up 40% to $400,000.

The average price per square foot is up 37% to $348 while the median price per square foot is up 40% to $337.

The average sales price to list price ratio was about 98% last January. That means that Big Bear home sellers conceded 2% off the list price on average in negotiations. This year that ratio was 104%. This means that on average sellers negotiated a sale price that was 4% more than their list price!

The average days on market for homes dropped 60% with homes selling 83 days quicker this January than in January 2020.

As if these numbers weren't spectacular enough, home inventory has been the big story this year and the main market force driving higher prices. Last January 15th we had 349 homes listed for sale. This January 15th we had only 62. That's an 82% drop in listings! (As of today, February 3rd, we have only 53 homes listed in the entirety of the Big Bear Valley.)

Because of the frustratingly low number of listings and with buyer demand so high, it is no wonder homes are selling for 104% of list price on average!

With mortgage rates remaining low and with the incredible frequency in which we are still receiving multiple offers resulting in bidding wars on many of our listings, I don't see this bull market in Big Bear real estate ending anytime soon!

Paul Zamoyta ~ info@Zamoyta.com ~ 909.557.8285

Posted in Market Reports
Jan. 4, 2021

2020 Big Bear Real Estate Year End Market Report

The inverted quote, "They were the worst of times. They were the best of times.", may be the best way to describe the year 2020 in the Big Bear real estate market.

We saw the lowest of lows in March when Big Bear home sales plummeted due to the onset of the Covid pandemic. Fear and uncertainty ruled the markets. It wasn't long though until Big Bear saw what was perhaps the most dramatic jump in market direction ever. Sales soared as people fled urban areas to the less populated and more outdoorsy regions such as Big Bear. Also fueled by a work force which in large part began working from home, fewer people listed their vacation homes for sale as they were now using them as their primary residences while others were experiencing record vacation rental income due to the urban exodus and thus were less likely to sell.

The overwhelming buyer demand for Big Bear homes far outweighed the supply of homes for sale. This pushed prices higher while competition often resulted in multiple offers and sales prices ending up well over list prices. The number of days on market that a home was listed before selling dropped significantly as well.

To quantify this summary, here are some figures and numbers to consider.


As mentioned, sales skyrocketed in 2020 to with 1749 Big Bear homes selling. This represents a 45% jump over 2019's sales. What makes this even more impressive is that this gain includes the first 2 months of the year where we saw flat sales numbers as well as the following 3 months of March, April and May where sales were about half of what they were the previous year. Sales from June through December much more than made up for the deficiencies we saw in the first 5 months of the year!

Here's a look at prices.


BIg Bear Real Estate 2020 Sales Prices


2020 Big Bear real estate sales price percent change

As these figures show, when compared to 2019, the average and median sales prices of Big Bear homes rose 33% and 20% to $470,630 and $360,000 respectively.

We see gains as well in the price per square foot measures.


The average and median prices per square foot rose 15% and 13% to $285 and $273 respectively.

The average sales price to list price ratio rose from 97% last year to 100% this year. This shows that on average, homes sold for full price in 2020.

As well, the Days On Market dropped 25% with homes spending a median of 52 days on market before selling.

One important thing to keep in mind is that all of these sales numbers include the first 5 months of the year which well underperformed those of the previous year. That means that measures such as the days on market were actually much lower in the last 6 months of the year than the annual number represents. This is true as well for the sales price to list price ratio which has been consistently over 100% for the last 6 months of the year.

With home inventory remaining remarkably low, buyer demand still extremely high, and with mortgage rates literally at all-time lows, there really doesn't seem to be an end in sight to the booming Big Bear real estate market. So far, it is looking like 2021 may be another spectacular year for Big Bear home prices as they catch up to the pricing of other desirable mountain resort communities!


Paul Zamoyta ~ info@Zamoyta.com ~ 909.557.8285


Posted in Market Reports
Nov. 11, 2020

October 2020 and Year-To-Date Update

October's Big Bear real estate numbers showed further market consistency as all major price measures showed remarkable gains in a same month comparison.

Big Bear home sales were up 40% this October as compared to October 2019. The average sale price was up 42% and the average price per square foot was up 24% over last October's numbers.

Looking back over the entirety of 2020, the following charts are a great way to see what has transpired this year in Big Bear real estate.

(Keep in mind when viewing these graphs that these figures represent the months when properties closed escrow. Typically, the offer on a property comes 30 to 45 days prior to closing. For example, September's sales were likely a result of homebuyers who made their offers in late July and August. So the sales in September really represent the market demand from the months prior.)


You can clearly see how the number of Big Bear home sales plummeted in April and May during the lockdown months. Equally as clear is how sales spiked immediately after the lockdown ended. Although sales have tapered in October, this is likely due to the lack of home inventory currently on the market. (More on that below.)


big bear real estate average sale price

As expected, when buyer activity spiked post-lockdown, the strong buyer demand pushed prices significantly higher with the average sale price showing consistent 37% - 42% gains when compared to the average sale price of homes during the same months in 2019.


median sale price big bear homes

Median sale prices of Big Bear homes showed slightly lower but still significant gains on a same month comparison.


big bear homes price per square foot

The price per square foot measure also increased, peaking at a 25% increase this October when compared to October 2019.

Perhaps the most revealing number in the Big Bear Real Estate market today is the number of homes listed for sale, better known as home inventory. As of today, there are only 106 homes for sale in the Big Bear MLS. This time last year, there were 455 homes for sale. That's more than a 75% drop in listings!

In the real estate world, we often show the relationship between buyer demand and the number of homes listed by dividing those 2 numbers giving us a measure called "months of inventory". This is a theoretical number that projects how many months it would take to sell all the current homes on the market if the sales pace stayed the same and no new homes came on the market. The lower the months of inventory, the stronger the market is.

Take a look at the figure below showing a brief history of months of inventory.

months of inventory BIg Bear real estate

A normal market will have about 5 months of inventory. This graph shows our current months of inventory at .6, an astonishingly low number! 

Because buyer demand for Big Bear homes has remained so strong and because the inventory of homes for sale has been progressively diminishing, prices are likely to continue to appreciate moving forward. Additionally aided by a recovering stock market and historically low interest rates, it is likely the bull market in Big Bear real estate will continue charging forward through 2020 and perhaps well into 2021!

Paul Zamoyta - Info@Zamoyta.com - 909.557.8285

Posted in Market Reports
Oct. 12, 2020

2020 Big Bear Real Estate Catch-Up

2020 will be a year that will certainly go down in Big Bear real estate history! The covid pandemic has left many people changing vacation plans that involved significant travel to farther away places for a more easily accessible getaway closer to home. With Big Bear's spectacular alpine setting less than a 3 hour drive for over 20 million people, our valley has experienced an unprecedented increase in visitorship as well as real estate sales. 

To quantify Big Bear's real estate boom, let's start with the last three months.

In a same month comparison to last year, the average sale price of a Big Bear home was up 39% in September. August sales also show a 39% increase, and July's numbers were up 35%. Astounding!

Sales this September were up almost 250% over last September.

September's average sale price of a Big Bear home was $531,945, the highest Big Bear has ever seen.

And perhaps the most telling stat of all is that the average home in Big Bear sold for OVER full price in September.

These numbers support what every Big Bear real estate agent has anecdotally experienced - multiple offers on most homes getting bid up to over list price with cash offers often winning out. As of late, buyers obtaining loans have been willing to remove appraisal contingencies and are willing to increase their down payments to secure a property as prices are accelerating so fast that appraised values are lagging. 

Working backwards, things weren't always this way in 2020. Take a look at the figures below.


Big Bear Homes Sales


Looking at the first figure, you can see that during the shutdown in April and May, sales were half what they were the previous year. But the real estate market in Big Bear took off shortly thereafter with September posting over double the number of sales from the previous year.

The second figure shows how prices stalled during the lockdown months only to see an unprecedented boom in prices over the last 3 months.

Yes, buyer demand has soared this year. But perhaps the more influential market condition that has driven prices higher is that the inventory of Big Bear homes for sale has never been lower. Currently, there are only 144 Big Bear homes for sale. Last year at this time, there were about 530 homes for sale. That's a 73% drop in home inventory!

With buyer demand still extraordinarily high, an extremely low level of home inventory, and mortgage rates hovering around all-time lows, the Big Bear market looks to be in a particularly strong position moving forward with additional price gains likely through the foreseeable future.


Posted in Market Reports
Aug. 25, 2020

July 2020 Big Bear Real Estate Numbers.... WHO KNEW?

Perhaps the most unforeseen shift in the history of the Big Bear Real Estate market occurred between April and May of this year when we saw our biggest consecutive month drop in sales followed by our biggest monthly increases through the following summer. We are still in the midst of the hottest market in anyone's memory as the Covid Pandemic has made life in the mountains exponentially more attractive to Southern Califonians.

To quantify this, lets compare the sales of Big Bear homes from July 2019 to July 2020.

July 2019 saw 105 Big Bear home sales whereas July 2020 saw 192 closings representing an incredible 83% increase in sales.

As you would imagine, prices have risen right along with the spike in demand. The average sale price is up 38% from last July at $455,950 while the median sale price is up 26% to $359,950. The average price per square foot is up 15% to $283 while the median is up 11% to $260.

One of the more impressive signs of the market's strength is that the median sales price to list price ratio is 99.5%. This means that properties are selling at almost full price more often than not!

But perhaps the most telling sign of the market's current strength is the listing to pending sales ratio. As of this morning, there are only 143 Big Bear homes for sale (a record low) yet there are 342 homes in escrow (a record high). This remarkable imbalance of incredibly high demand and sparse supply clearly suggests that the market will remain strong for the foreseeable future. When you consider that interests rate will likely remain at their historically low rates, with a continued seller's market, prices are likely to continune their ascent toward all-time highs.

But just like the market unexpectedly spiking this summer, I think uncertainty has become the most certain thing in today's market. So stay tuned to my blog for updates moving forward in 2020!


Posted in Market Reports
June 2, 2020

May 2020 - Big Bear Real Estate Report

May's sales continued to show the effects of the Covid-19 epidemic with only 49 closings of Big Bear homes. This is down 52% from last May. As mentioned in previous posts, May is the first month where almost all of the closings would have gone into escrow around or during the Covid outbreak. So these sales represent those still willing to buy during the height of the pandemic.

That being said, prices showed mixed messages with the average Big Bear home price rising 6% to $383,801 while the median dropped 15% to $265,000. The rise in average price can be directly attributed to a few very high end sales swaying the small sample size of sold homes. The drop in the median is also likely exaggerated due to the small sample size, but is likely more accurate of market direction.

The average sales price to list price ratio has remained about the same at 97% - 98% while the average and median days on market have barely moved at 113 and 65 respectively.

The big silver lining to all this is that our pending sales - homes that are currently in escrow - are near all-time highs right now. With 170 homes currently in back-up or pending position, you have to go back to 2013 to see a higher number for this time of year. Assuming these current pendings close, we should see the market bouncing back quite quickly heading into summer.

After Big Bear home sales being down over 50% in both April and May, I would expect sales to make significant gains over the next few months.

Posted in Market Reports
May 26, 2020

Big Bear Real Estate Report - April 2020

April 2020 is the first full month that quarantine was in place. This should give us a good idea as to the Big Bear real estate market's initial response to the Covid-19 crisis.

Not too surprisingly, looking at a same month comparison, Big Bear home sales took a 58% drop with only 45 closings in April. The average sale price dropped less than 1% to $333,975 while the median price increased a modest 2%. The average and median price per square foot rose 2.5% and 3% respectively to $255 and $243. The median days on market stayed steady at 67 days.

Although a drop like this was to be expected, I think the first tell-tale sign of where things are going will be next month's numbers. I remain hopeful that once the initial shock wears off, buyers will come back into the market.

Two particular reasons for optimism are the low interest rates and new found focus on rural living over urban and suburban lifestyles. 

One other interesting development from last month was that not only did sales slow, but the number of new listings did as well. So from a supply and demand perspective, the market is still in a very good place.


Posted in Market Reports
April 6, 2020

MARCH SALES AND PRICES GAIN IN MARCH AMID COVID THREAT

There seems to be two different minds in regards to the Covid pandemic's effects on the Big Bear real real estate market. One is that the economy will suffer greatly with real estate not being an exception. The other is that this event will be short lived and the dip in the economy will be temporary.

No one knows for sure what's in store for the Big Bear real estate market, but what we do know for certain are the current market numbers telling us how the market has fared so far.

On that note, March sales were up 14% rising from 82 sales last year to 95 sales this year. Being that the realities of the Covid threat really set in around the middle of the month and shelter-in-place orders took place shortly thereafter, I compared March's sales over the last two weeks of the month as well. In both 2019 and 2020, the last two weeks of the month both saw 50% of the total month's sales. So sales did not slow even after the shock of Covid set in!

Keep in mind that homes that sold over the last two weeks of March had likely been in escrow for at least two weeks (and likely much longer) prior to the Covid threat being realized. Although sales that were already pending didn't seem to be affected, I think it was a good sign that few people backed out of their transactions in the midst of economic uncertainty.

April will be a much better indicator of what effects Covid may be having on the market with May really being the month that will let us know the impact. Most May sales will likely reflect homes that went into escrow after California's shelter-in-place orders took effect. 

As for Big Bear home prices in March, we saw a small 3% drop in average sale price to $365,371 but a 5.5% increase in the median sale price to $325,000. The average and median price per square foot bot rose 8% and 7% to $260 and $253 respectively. The sales price to list price ratio stayed at 97% and the average days on market dropped from 114 days to 101 days.

I will be keeping an eye on the market moving forward and will update this blog every two weeks to see if and how the Big Bear real estate market is responding to the latest economic news and the Covid situation.

Until then, everyone be safe and stay healthy!

Posted in Market Reports
Jan. 16, 2020

2019 BIG BEAR LAKEFRONT MARKET REPORT

Big Bear lakefronts often experience different price and sales trends than those seen in the overall real estate market. There are many reasons why this is the case. 

For instance, lakefronts are far more affected by Big Bear Lake's water levels. Looking at historical sales numbers, sales are generally down in the low lake level years and higher when the lake is closer to full. As well, lakefronts tend to be among the most expensive properties in Big Bear which oftentimes bring different concerns when purchasing, such as potential tax consequences or specific expectations of a property's condition. Lastly, the number of lakefronts listed at any given time tend to be quite limited. So although we may have well qualified buyers, there may not be the type of lakefront they are looking for on the market, thus suppressing the number of purchases.

Because the lakefront real estate is so different, it deserves to be looked at differently than the market as a whole..

Before reviewing the information below, keep in mind that the very small sample size of sold lakefront properties each year can make sales numbers more difficult to interpret. For example, it only takes one very inexpensive or one very expensive sale to significantly sway the sales data one direction or the other. My role as an agent is to know the details about the specific lakefront properties that sold so that an accurate interpretation can be made on what's going on in the market. That is what I hope to accomplish in the following review.

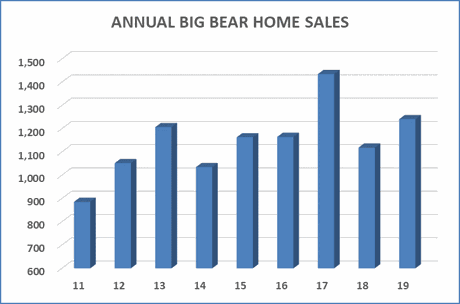
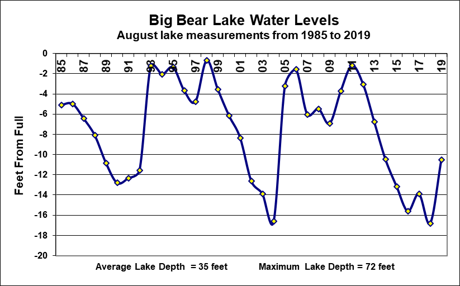
In this regard, let's take a look at 2019's sales numbers in the figure below. After a very slow sales year in 2018 when the lake's water levels were the lowest they'd been in almost 50 years, we saw a bump in sales after the wet, snowy winter added 9 feet to the lake's elevation. Unfortunately, the lake still remained over 10 feet from full which hampered the sales rebound somewhat, leaving many prospective lakefront buyers hesitant about the lake's water levels. Hopefully with the stormy winter we've had so far this year, our lake's water levels will be closer to full come next summer.


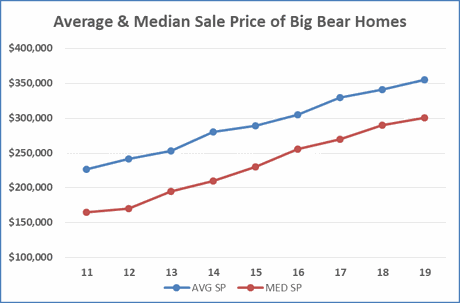
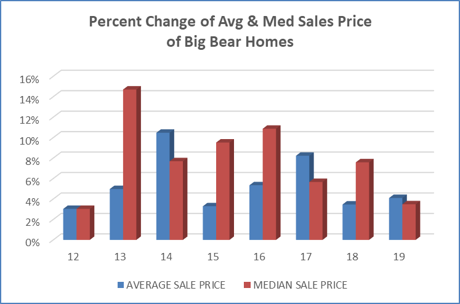
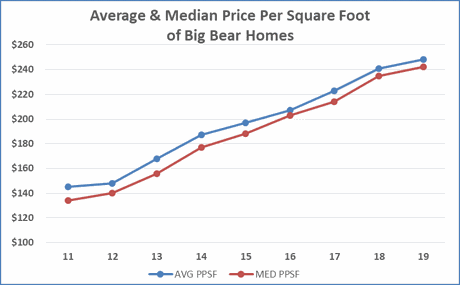
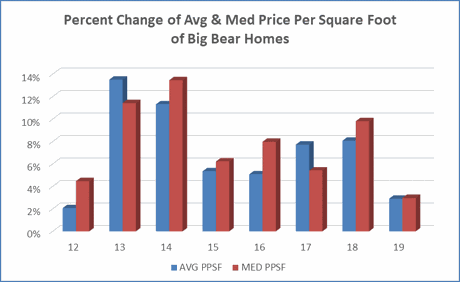
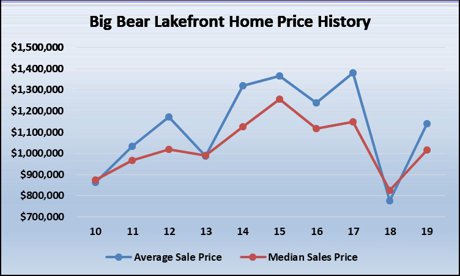
Looking at the figure below, you'll see that the average and median sales prices and prices per square foot of lakefronts rose this year as well. Although this is the case, as previously mentioned, lakefront sales numbers often need interpretation. 

For instance, the figure below shows that the average sale price fell almost 50% last year, but that does not mean the actual value of lakefronts fell to that extent. With the lake hitting a 50 year low in 2018, many shallow water lakefront owners lowered their list prices significantly to get sold. These shallow water homes tend to be less expensive in general, and with the owners willing to take even less due to poor lake conditions, many buyers picked these homes up at a bargain price in exchange for assuming the low water level risks.

Although prices bounced back somewhat, we still had quite a few sales in the lower price ranges this year as well as many lakefronts that needed significant improvements. This hampered the price rebound.

Again, this sales price history should not be applied to each individual property but still can be a guide to explain what's going on in the market. The most accurate way to know a particular property's value is to have an agent familiar with the lakefront market do a comparable market analysis.


Price per square foot measures also need to be interpreted taking into consideration the nature of the lakefronts that sold. As mentioned above, many of the homes that sold were older and in need of updating, remodeling, or other improvements. These homes sell at a lower price per square foot than homes that are newer or fully remodeled already. Again, each individual property is different and simply applying the price per square foot average to the square footage of one's property would likely not provide an accurate valuation. 


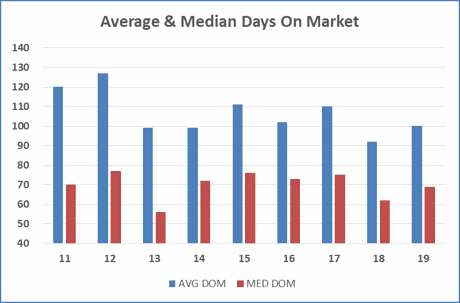
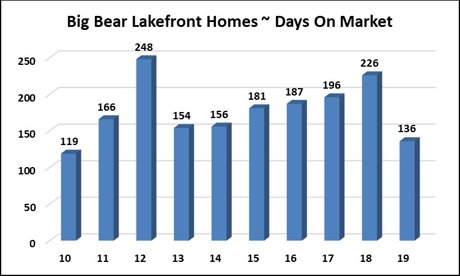
You'll see below that the average time a home was on the market before selling fell significantly this year. In fact, 2019 had the lowest D.O.M. in almost a decade. Again, being familiar with the individual lakefront sales in 2018, the D.O.M. that year was unusually high due to long-listed shallow water lakefronts finally selling. 2019's D.O.M. offers a more accurate reflection of true time on market.


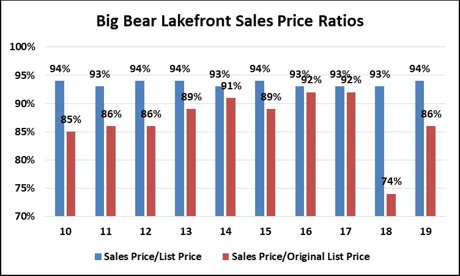
The sales price to list price ratio figure below shows not only how much lakefront owners dropped their list price in negotiations, but it also showed how much sellers conceded off their original list price. These numbers also reflect how the average lakefront seller dropped their original list price before receiving the offer which they subsequently negotiated. This suggests there were many sellers that tested the market at a higher price before finding it necessary to lower their list price in order to get sold.


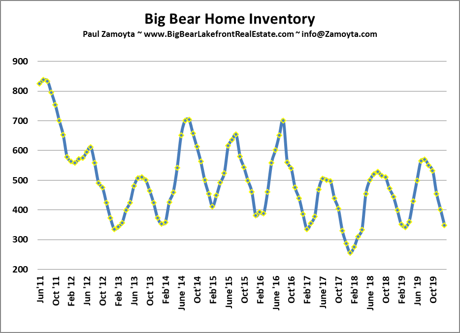
Lastly, lake levels undoubtedly have an effect on lakefront sales. Case in point, in the last decade, the highest number of sales was in 2012 when the lake was near full and the lowest was in 2018 when the lake was at its lowest point in 50 years. As previously mentioned, the lake filled a significant 9 feet last winter but was still almost 10 feet from full. Unfortunately, many buyers were still hesitant due to the remaining low water levels. If we continue to get the storms we've had so far this winter, the lake will most certainly be closer to full come summer.


In addition to these sales figures, there are a couple other issues to consider that affect the lakefront market.

New tax laws limit the amount of mortgage you can deduct as well as no longer offer a deduction for state property taxes. I have had several buyers mention this concern when deciding whether to buy. I would assume this will be become "the new normal" though and be a less common concern for buyers in the future.

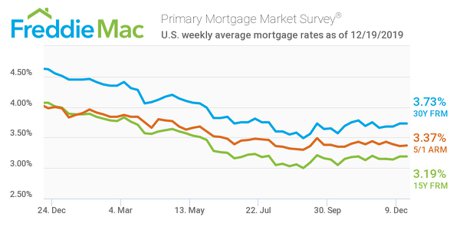
On a more positive note, mortgage rates have remained historically low, having stabilized after dropping through most of 2019. These low rates have really helped the push the current bull market in real estate into it's 10th year.


Lastly, a few items to note that you might find interesting about  2019's lakefront sales:

The highest priced lakefront to sell was $2,600,000 and the lowest was $425,000.

The highest price per square foot was $528 and the lowest was $375.

The longest days on market was 447 while the shortest was 4.

The highest sales price to list price ratio was 101% and the lowest was 93%.

The biggest home was 6 beds, 6 baths, 5107 sf and the smallest was 2 beds, 1 bath, 1245 sf.

The lake's highest water level was 9"2" from full and the lowest was 12'1" from full. (The lake typically loses about 3 feet mostly due to evaporation over the summer months.)


Overall, 2019 was a nice rebound from a less than stellar 2018 year for lakefronts. With the economy still going strong, with continued improvements at the resorts and in the community attracting more visitors, and with remarkably low mortgage rates, I think 2020 will be a busy year in the Big Bear lakefront real estate market.


Paul Zamoyta ~ info@Zamoyta.com ~ 909.557.8285


Posted in Market Reports
Jan. 16, 2020

2019 BIG BEAR REAL ESTATE MARKET REPORT

Big Bear home sales as well as all four price measures were up in 2019 compared to 2018.

After 2018 saw an unusual dip, sales rebounded 11% in 2019 with 1241 closings. This was the second highest number of home sales we've seen on an annual basis in the past decade. I would attribute this rise in closings to a strong economy, historically low interest rates, a snowy winter resulting in the lake's water levels rising over 9 feet, and continued improvements at our local resorts and in our community in general.


This increased buyer demand for Big Bear homes pushed the average and median sales prices higher once again capping an impressive 9 year run. 


The average and median price per square foot of sold Big Bear homes rose as well for the 9th consecutive year.


The number of Days On Market (DOM) it took for a home to sell rose marginally but still remained below the 10 year average.


Home inventory stayed relatively stable with just a slight rise in the average number of homes listed for sale.


Mortgage interest rates have fallen in the past year and have stabilized in the remarkable sub-4% range. Continued low rates will help keep the real estate market strong.


Overall, 2019 was a great year for the Big Bear real estate market. Sales up, prices up, snowy winter, a more full lake, low interest rates, and a community that keeps investing in making Big Bear a more desirable place to vacation. More importantly, there are no signs that suggest that 2020 will be any different. 

Remember to check in regularly to my blog to keep update on the Big Bear real estate market's progress throughout the year!

Paul Zamoyta ~ 909.557.8285 ~ info@Zamoyta.com


Posted in Market Reports