Following up on the last two posts which looked at a 2014 to 2015 Big Bear real estate market comparison and a longer term look at market direction going back 10 years, I wanted to split the difference and look at the market from a mid-range perspective.
First let's look at the market rebound that started when Big Bear home prices bottomed out in 2011.
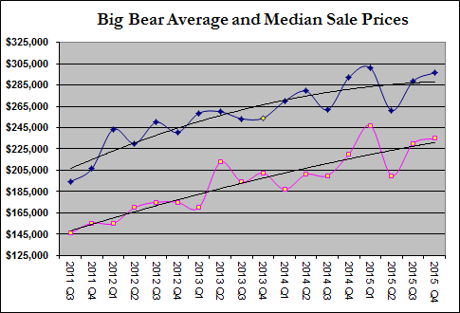 Looking at the trend line, you can see a fairly steady rise in the average and median Big Bear home prices. But if you pay particular attention to 2015's quarterly numbers, you start to see evidence of the home appreciation rate tapering off.
Let's now look at the same time period showing the price per square foot numbers.
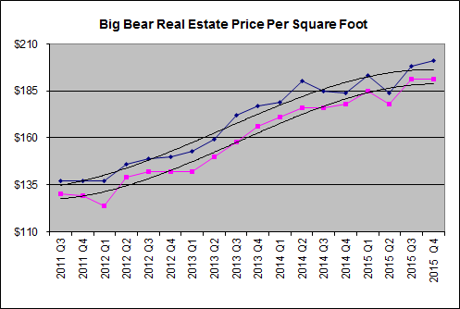
Again, we see a fairly steady rise in the average and median price per square foot of sold Big Bear homes. But looking at the trend line, you see a definitive leveling off heading through 2015.
Being that the Big Bear real estate market is relatively small and that the limited number of home sales can result in more data anomalies, we will have to wait and see if this trend holds true over the longer term. Regardless, we are still seeing home prices rise, albeit at a somewhat slower rate than we saw from 2012 through 2014.
As mentioned in previous posts, with sales up and inventory down in 2015, and with interest rates still hovering around the 4% range even after the Federal Reserve raised rates, the Big Bear real estate market still seems to be in a very solid position.