Now that the third quarter of 2013 is over, there's no better time to take a look at a quarterly history of Big Bear real estate.

From this chart, you can see that as the market turned around in late 2011, we saw a steady rise in prices through 2013 but there seems to be some leveling off going on right now. With interest rates edging higher over the past quarter and with consumer confidence waining due to debt limit and government shut down talk, it wouldn't surprise me to see the hot market cool down a bit. But average and median sales prices are just one measure of what is going on. Let's take a look below at the price per square foot measures.
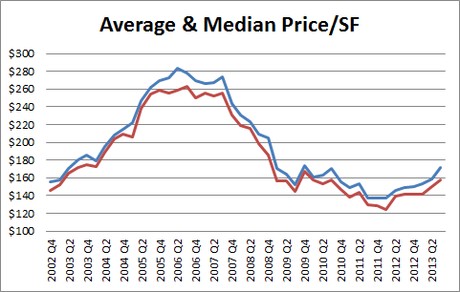
Unlike the leveling we have seen in the average and median sales prices, the price per square foot comparisons show that values are continuing to increase through 2013. Whereas the average and median sales prices can be swayed by many high-end or low-end homes dominating market sales, the price per square foot measures are a better indication of market direction as they show how much you can expect to pay for a certain amount of house. Based on this, I see continued appreciation moving forward in the foreseeable future.
Ultimately, the health of any real estate market is based on the elements of supply and demand. So let's take a look at the demand to buy homes and compare that to the supply of homes listed for sale.
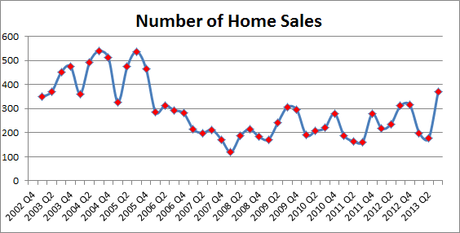
Going all the way back to 2002, you can see that home sales are quite cyclical. Summers are the busiest time of year while winters are more subdued. But looking closely at the Q3 numbers for this year, you will see a significant spike in the number of Big Bear homes sold. This increased actitivty is a great sign that buyers are as active as we've seen in quite some time.

Looking at the number of homes listed for sale in Big Bear, you'll see that after our cyclical summer peak, we have started our predictable decrease in listings heading into the winter months. If you compare the number of listings currently to where they were in the previous two years at this time of year, you will see that we are still slightly below last years listings and substantially below the listings from the year before that.
So with listings trending lower and the number of sales (representing buyer interest) rising, the laws of supply and demand suggest we have a healthy real estate market.