Your Big Bear Lakefront Real Estate Blog

An up-to-date resource for lakefront market reports, news, and infomation...

June 5, 2018

Big Bear Lakefront Real Estate Update - May 2018

MAY BIG BEAR HOME SALES

Although sales continue to be below last year's levels, prices have continued to show double-digit gains.

Sales still lagged due to the poor winter snow season resulting in a 9% drop from 116 Big Bear home sales last year to 106 this year.

Despite this slowdown, both the average and median sales prices increase 22% and 15% to $363,290 and $299,250 respectively. The average and median prices per square foot rose 19% and 18% to $254 and $250 respectively.

The average days on market dropped from 106 to 79 days while the median dropped from 63 to 55.

YEAR-TO-DATE BIG BEAR HOME SALES

So far this calendar year, although Big Bear home sales are down 13%, the average and median sales prices are both up 15% to $355,140 and $295,000 while the average and median prices per square foot are both up 14% to $243 and $237.

The average days on market has dropped from 107 to 94 days while the median dropped from 67 to 63 days.

Being that our year-to-date measure now has five months of data, the accuracy of the price gains becomes quite reliable. In addition, having a four price measures showing such similar gains (all 14% or 15%), I feel that these numbers are substantially accurate. In this regard, a 15% appreciation in home values over the last 12 months is really impressive!

BIG BEAR REAL ESTATE FORECAST

Although sales are slightly down this year, the aforementioned price appreciation shows that buyers are still willing to pay top dollar for Big Bear real estate. As mentioned above, the slowdown in sales is likely to the decrease in visitors this winter due to our dry, warm ski season. With our busiest season for home sales fast approaching, I will be interested to see whether sales rebound as expected.

Regardless of whether buyer demand increases, the supply of Big Bear homes for sale is still remarkably low. April's reading showed only 333 Big Bear homes for sale as compared to last April's 379 and April 2016's 461.

Perhaps the only negative in today's market is that interest rates keep creeping up. Although still near historically low levels at about 4.7%, they are nowhere near the recent 2012 low of 3.31%.

Once again, things are looking good for the Big Bear real estate market heading into summer. I expect sales to rebound and prices to continue to rise as visitors flock to the valley to escape the heat and enjoy life on the lake and in the mountains.

May 7, 2018

April 2018 Big Bear Real Estate Report

Although sales continue to lag due to the warm, dry winter Big Bear experienced in 2017-2018, prices continue to push upward.

Compared to last April, this April saw sales of Big Bear homes drop 22% to just 74 closings.

In spite of this, the average and median sales prices were up 19% and 7.5% to $299,912 and $259,000 respectively. Both the average and median prices per square foot also rose 4% and 8% to $228 and $211 respectively.

The average Days On Market dropped slightly from 100 to 97 while the median dropped from 64 to 53. The sales price to list price ratio stays strong in the 97%-98% range. So Big Bear homes are selling quicker and are still selling close to list price.

Looking at the Big Bear real estate market from a year-to-date perspective, sales are down 14% so far in 2018, but all four major price measures are showing double digit gains.

The average and median sales price are up 13% and 15% to $311,227 and $255,000 respectively. The average and median price per square foot both rose 13% to $228 and $211 respectively.

The average Days On Market dropped from 107 days to 99 days while the median fell slightly from 70 to 68. The sales price to list price ratio is still in the 97% to 98% range.

The main drivers for the continued market appreciation are the strong economy and low home inventory. Although sales have slowed this year due to a poor winter season, the historically low home inventory has still kept supply lower than demand. The figure below shows a five year history of Big Bear home inventory.

big bear home inventory

With so few homes for sale and with Big Bear home sales expected to rise as our busy summer season approaches, prices are poised to rise through the foreseeable future.

Posted in Market Reports
April 10, 2018

March 2018 Big Bear Market Report - Prices Rise While Sales Dip

Same Month Comparison - Comparing Sales from March 2017 to March 2018

This March saw a continuation of the trend we've seen over the last few months as sales of Big Bear homes were down while home prices continued rising significantly.

Sales slid from 107 closings last March to 97 this March representing a 13% drop in sales.

Meanwhile, the average and median sales prices both rose 13% to $356,696 and $300,000 respectively. The average and median price per square foot of sold Big Bear homes rose 16% and 20% to $246 and $239.

Unfortunately, the Days On Market - the number of days a home was listed before going into escrow - rose significantly from 97 to 129. I am guessing this jump is just a blip in the data for this month and not a longer term trend.

Year-To-Date Comparison - Comparing Sales from January 1st Through March 31st in 2017 to those in 2018

Comparing the last 3 months of sales, closings are down 11.5% this year. This is likely due to the poor snow year we had and the resulting decline in visitors to the valley. Fewer vacationers means fewer people who get interested in buying a Big Bear home which means fewer Big Bear home sales.

But not unlike the March same month comparison, prices saw impressive double digit appreciation over last year.

The average and median sales prices rose 11% and 17% to $350,633 and $295,500 while the average and median price per square foot rose 16% and 13% to $239 and $228 respectively.

The Days On Market dropped from 109 days to 100 days while the average sales price to list price ratios stayed steady around 97%-98%, showing that sellers typically conceded 2%-3% during negotiations.

Market Summary and Outlook

With sales dipping and interest rates rising about .5% from this time last year, you might have expected home value gains to level off. But Big Bear home prices once again showed double digit jumps as the strong national and Southern California economies are fueling market gains.

I am keeping an eye on the number of home sales moving forward. It will be interesting to see if home sales recover as summer approaches. Otherwise, the market remains strong with no signs of slowing down over the foreseeable future.


Posted in Market Reports
March 7, 2018

February 2018 Big Bear Home Sales Report

Comparing February 2018 to February 2017, Big Bear home sales slid about 11% with 66 closings last month. Most attribute this slow down to the lack of snow and consequent drop in visitors to the Valley this winter. However, in spite of sales being slower, prices showed strong gains.

In a February same-month comparison, the average and median sales prices were up 17% and 28% to $372,421 and $330,500 while the average and median prices per square foot were up 17% and 14% to $240 and $225. If these numbers seem too good to be true, it's because they probably are not telling the whole story. As I have mentioned in previous posts, in our slowest months there are so few sales that a few very high-end sales or low-end sales might sway the numbers too sharply in one direction or the other.

So let's look a a year-to-date comparison looking at sales from January and February of this year and comparing to that same time period from 2017. By adding more sales, the numbers should become more "realistic" in regards to growth.

When doing so, we see that sales are still down 10% so far this calendar year with 140 closings. The average and median Big Bear home prices show a 10% and 12% appreciation to $346,606 and $279,500 respectively. The average and median price per square foot also rose 12% and 14% to $234 and $226. This double digit annual appreciation seems to be a more realistic reflection of what's going on in the Big Bear real estate market.

Both sets of numbers show that Big Bear homes prices are continuing to appreciate at a healthy pace. 

Looking at other indicators, the average Days On Market has risen slightly from 104 last year to 117 this year while the average sale price to list price ratio has stayed about the same at 97.43%. The stability of these numbers is a good sign for the market.

Following interest rates, we have seen about a .5% rise over the last few months. Being that we're still at incredibly low rates in the mid 4% range, I don't think the slowly rising interest rates have had a big effect on the market to this point.

Lastly, perhaps the healthiest sign in today's market is the incredibly low inventory of Big Bear homes for sale. Currently in the Big Bear MLS, there are only 280 home listings. To put this in perspective, the figure below shows a short history of inventory.

Big Bear Home Inventory

With inventory so low, buyers compete to buy listings thus driving prices higher. Coupled with decent interest rates and a strong economy, things are looking good for the Big Bear real estate market in 2018.

Posted in Market Reports
March 1, 2018

Big Bear Lake's Changing Water Level and Its Effect on Home Sales

Lake Level History

In the midst of one of Big Bear's driest winters on record, there seems to be continued concern about the effect that Big Bear Lake's low water levels may have on real estate sales. If you've lived in Big Bear long enough, you've seen the lake this low before. In fact, if you look at the records from the Big Bear Municipal Water District, you'll see what appears to be somewhat of a pattern in the fluctuation of lake levels over time.

Bigh Bear Lake Levels March

Noticing the up and down nature of the lake's water levels, it is interesting to see how it takes several years for levels to decline yet the lake typically bounces back much faster. Two examples of this are when the lake filled 12 feet in 1992-1993 and 10 feet in 2004-2005. This leaves hope that if and when Mother Nature does decide to show up, the lake can - and historically does - fill up quickly.

Also note that the graph above shows measurements for the month of March. Typically, the lake will lose between 3-5 feet of water from its high point in the spring to its low point in the late fall. For example, when the lake was at this low a level back in 2004, the high point of the lake was in April when it was 14 feet 2 inches from full. By October of that year, the lake hit a low of 17 feet 6 inches, representing a drop of 3 feet 4 inches over the summer months.

If the lake has similar declines this summer, we may see the lake drop to 18 - 19 feet from full, which would be the lowest point in the 32 years that the BBMWD has kept records.

Miracle March?

As of late, I have heard a few local optimists predicting another "Miracle March", suggesting that the lake may still see significant help before winter's end by a potential flurry of late season storms.

The legendary and renowned "Miracle March" occurred in 1991 when Big Bear received 24.24 inches of precipitation, much of it in the form of snow, during the 31 days of March. In comparison, here are the precipitation numbers in inches for the month of March over the last five years; 1.08, 3.33, 1.28, 2.48 and 1.48. So the 24.24 inches from March of 1991 made for quite a white and wet month and is deserving of legendary status.

But how much of a difference did 1991's Miracle March make for the lake's water level?

In February of 1991, right before the "miracle", the lake was at 14 feet 6 inches from full. The high point of the lake later that year was 11 feet from full. So even with over 24 inches of precipitation in March, the lake level only rose 3.5 feet that year. In short, although a March Miracle would be welcomed, it might not result in the water level rebound one would expect.

Do Lake Levels Affect Big Bear Home Sales?

Ultimately, there are too many factors to be reliably certain of the water level's influence on Big Bear home sales. But looking at some of the sales data from 2004-2005, when the lake rebounded from 17 feet from full to just 3 feet from full in one winter, might give us some insight.

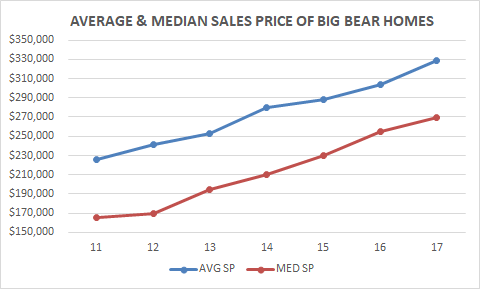
Take a look at the history of Big Bear lakefront home sales:

Big Bear Lakefront Home Sales

Note that lakefront home sales almost doubled from the 'low water year' of 2004 to the 'high water year' of 2005. This data certainly suggests that lake levels likely play a significant part in lakefront home sales. Also note that the second highest year for lakefront home sales was 2012, when the lake topped out at almost full capacity.

When we look at home sales for the overall Big Bear real estate market though, there were 1905 total sales in 2004 and 1802 total sales in 2005. So while sales of lakefront properties almost doubled when the lake filled up, overall sales were relatively unchanged, and in fact declined a little.

In my opinion, this strongly suggests that lakefront home sales can significantly be affected by Big Bear Lake's water levels, yet they have little bearing on the overall real estate market (non-lakefront) in general.

What Does this Mean for Lakefront Buyers and Sellers?

For sellers, it's really a bet as to if and when you think the lake will fill up again and whether you could take the proceeds from selling at a lower price today and invest it elsewhere for a greater, more assured profit over time.

For buyers, it is a bet as to how long it will take for the lake to fill up and potentially see significant gains on investments. For lakefront buyers, buying low and selling high has a literal meaning. If you buy when the water is low at a discount, you may be able to sell for significantly more once the lake levels are high.

Summary

Quite simply, we're likely to see some pretty low lake levels this summer. Before panicking, it's important to realize that the lake has historically had its ups and downs. Although lakefront home sales may be affected, the overall market will likely not be influenced much.

For lakefront buyers and sellers, it's really a guessing game as to when the lake's water levels might see better days again. Absent a crystal ball, nobody can tell you the future of Big Bear Lake. But referring back to the lake level graph at the beginning of this post, the previous patterns suggest we might see the lake levels bouncing back sooner rather than later.


Feb. 5, 2018

January 2018 ~ Big Bear Real Estate Market Update

January's numbers are in! Although the number of Big Bear homes sold dipped a little, prices and other market indicators showed appreciation and improvement. 

Let's take a look...

January Number of Big Bear Homes Sales

The number of sales of Big Bear homes slipped a little this January. This is likely due to the lack of snow we've had this year. Less snow means fewer visitors which means fewer sales. As well, the lack of home inventory has hampered sales as many buyers are having trouble finding the type of home that fits their wants and needs.

January Big Bear Home Sales Prices

Although there was a dip in home sales, both the average and median sales prices of Big Bear homes continued to rise to their highest point in almost a decade. This is likely due to a strong economy and continued low interest rates.

Big Bear homes - price per square foot

The average and median price per square foot of Big Bear homes showed continued appreciation as well. These price measures have risen about 75% since the market's bottom in 2011.

Days On Market - Big Bear Homes

The average and median number of days that a home was listed for sale, better know as D.O.M. (Days On Market), continued to decline as homes sold at their quickest pace in 4 years. This is due, once again, to the lack of home inventory. With fewer homes on the market, buyers are quick to act when a home that meets their wants and needs lists for sale.

Big Bear Homes - sales price to list price ratio

The Sales Price to List Price ratio of homes stayed steady, as buyers were willing to pay about 97.5% of list price this January. Sellers conceding only 2.5% off their list price on average in negotiations is evidence of a continuing strong market.

BIg Bear Home inventory

Lastly, as mentioned in previous posts, perhaps the strongest sign of today's Big Bear Real Estate market is the low inventory of homes. With only 250 Big Bear homes for sale as of February 1st, listings are near record lows. This lack of supply and continued buyer demand suggests that prices will continue to rise for the foreseeable future.


Paul Zamoyta ~ Info@Zamoyta.com ~ 909.557.8285


Posted in Market Reports
Jan. 30, 2018

Big Bear Cash Home Sales Offer Market Insights

I oftentimes get my ideas for blog posts by overhearing statements made about the Big Bear real estate market that I am not quite sure are fact-based. In this regard, today's post was compliments of a conversation I heard about cash sales.

In this conversation, the following claims were made:

1) Cash sales are rare. Fewer than 10% of Big Bear homes are purchased with cash.

2) Buying a home with cash allows you to purchase the home for far less than you could than if you had purchased with a loan.

3) Most people who buy with cash are affluent, so it's usually the higher-end homes that sell for cash.

All three of these seemed like reasonable assertions. But I turned to the Big Bear MLS to test these claims.

Take a look at the figure below showing the number of cash sales over the past 11 years.

Big Bear Homes - Cash Sales

Back in 2007, you see very few homes purchased with cash. This was at the height of the record real estate boom when just about anyone could qualify for a home loan. As the real estate market collapsed, loans became more difficult to qualify for and cash sales increase not only in number, but also grew as a percentage of all Big Bear home sales.

But our first claim was that cash sales made up less than 10% of all sales. Take a look below.

At Big Bear real estate's lowest point, only 10% of all sales were cash. This was at the market's height when prices topped out. Conversely, cash sales as a percent of all sales peaked in 2011 at the bottom of the market. Savvy investors who were sitting on cash took advantage of the 50% drop in Big Bear home values resulting in cash sales making up 35% of all sales. As the market recovered, cash sales have settled back down to about 20%-25% of all sales.

So our first claim was debunked.

Let's look at the second claim; that purchasing with cash allows you to pick up a Big Bear property at a discount price.

I ran the numbers on Big Bear home sales going back to 2011 and found that the average sales price to list price ratio for cash purchases was 95.87% while the ratio for non-cash purchases was 97.26%. This suggests that cash purchasers have a 1.39% advantage in negotiations. Based on the average sale price of Big Bear homes from the last quarter of $356,000, this results in about a $5000 advantage for cash buyers. 

Is $5000 a major discount on a $365,000 purchase? Some might say that $5000 is significant while others will say that getting a 1.39% return on your cash investment is ridiculously low.

I will leave judging the legitimacy of this claim up to you.

Lastly, there was the claim that only affluent people purchase with cash, therefore most cash sales are in higher-end, luxury homes.

Once again, looking at the numbers going back to 2011, the average sale price of homes purchased with cash was $263,639 compared to $271,504 for non-cash sales. Being that these sales prices are so similar (less than 3% apart), this suggests that cash sales do not occur predominantly in the higher price ranges, but are more likely are distributed throughout all price ranges.

So claim three is debunked as well. 

To me, the interesting takeaway in looking at cash sales is how they may give valuable insight into the Big Bear real estate market.

Cash sales were lowest in 2007 when prices were highest and buyers had ridiculously easy access to mortgages. This set up the market collapse in 2008. So a low number of cash sales may signal a market high-point.

Cash sales were highest when the market bottomed in 2011 and prices were at their lowest. So a high number of cash sales may signal a market turnaround.

In the last few years, we've seen qualifying for loans become much easier. In fact, we are starting to see stated loans and "hard money loans" creep back into the market. Although we are far from the free-flowing credit of the mid-2000s, the lending market definitely seems to be moving in that direction. It will be interesting to see how cash sales evolve over the next few years and if they may help us predict which way the Big Bear real estate market is headed.


Paul Zamoyta ~ Info@Zamoyta.com ~ 909.557.8285 


Posted in Market Reports
Jan. 25, 2018

Fewer Big Bear Homes for Sale Makes for a Strong Real Estate Market

As I frequently mention in my blog, real estate often boils down to Economics 101, particularly in regards to the theory of supply and demand.

When there are a lot of homes for sale (high supply) but very few people who are looking to buy those homes (low demand), prices will fall as sellers will have to drop their prices to make their homes more appealing to buyers. 

But when there are very few homes for sale (low supply) while there are many buyers looking for homes (high demand), prices will rise as sellers command a stronger position in negotiations due to there being more competition among buyers vying for the few homes that are for sale.

Currently, the Big Bear real estate market has the fewest number of homes for sale dating back at least a decade and likely much longer than that. Take a look at the figure below.

Big Bear Homes for Sale

As of this morning, there were only 256 Big Bear homes for sale in the entire valley per the Big Bear MLS. This represents a whopping 70 percent drop in listings since I started keep track in 2011. Anecdotally, most agents remember there being about 1200 listings back in 2009 when the market turned for the worse. Based on that number, we are seeing an incredible 80 percent fewer listings.

As far as buyer demand, here is a figure that shows the number of listings from a given month divided by the number of sales from that month. This measure is referred to in the business as "Months of Inventory". It is the best way to display supply and demand in the market.

In a normal market, there is usually about 4 to 6 months of inventory. Right now, we are close to just 2 months.

All this is good news for the Big Bear real estate market. With prices rising as buyers compete for the few homes that are for sale in Big Bear, with interest rates still near the 4% mark, and with all other economic news trending towards the positive, I would expect another great year for Big Bear real estate in 2018!


Posted in Market Reports
Jan. 19, 2018

2017 Big Bear Real Estate Market Report Update - Annual Numbers

After reviewing my last post, a few readers reached out and asked if I could break Big Bear home prices down on a yearly basis. Here are a few graphs in this regard.

Here's the yearly average and median sale prices of Big Bear Homes per the Big Bear MLS data.

Big Bear Home Prices

I went ahead and did the math for you on the percentage of increase over the prior year for the sales prices and graphed it below.

Big Bear home prices - percentage increase

Here are two graphs showing the annual increase in price per square foot of Big Bear homes sold in both sales price and percentage increase over the previous year.

Price Per Square Foot - Big Bear Homes


Posted in Market Reports
Dec. 30, 2017

2017 - Big Bear Real Estate - Year End Market Summary

With the last business day of 2017 behind us, I reviewed the market numbers for this year to see how we fared compared to last year. I also took a look at where we are from a longer term perspective.

Here are a few graphs that tell the big story.

Average and Median Sale Price of Big Bear Homes

Compared to 2016's numbers, the average sale price of a Big Bear home rose 9.5% to $338,973 while the median sale price rose 5% to $268,500. For a longer term look, check out the figure below.

Big Bear Real Estate Values - 2017

You can see that Big Bear real estate has been steadily recovering since the market's bottom in mid-2011, but we're still about 15% behind the market's peak in early 2007. The market is definitely moving in the right direction with several positive influences that will likely spur future appreciation. More on that later.


Price Per Square Foot of Big Bear Homes

Compared to 2016's numbers, we saw the average price per square foot rise 7% to $223 this year while the median rose 6% to $214. Here's a figure showing the longer term trend for the price per square foot measure.

Big Bear Real Estate - Price Per Square Foot - 2017

Once again, we see the price per square foot of Big Bear homes peak in 2005 - 2006 with the market bottoming out in 2011. Although these measures have risen steadily about 70% since the market bottom, we're still about 20% behind peak prices. 


Big Bear Home Sales

Big Bear homes sales were up an impressive 23% over last year with 1425 closings in 2017. Here's a look at sales going back over a decade.

Big Bear Homes Sales 2017 HIstory

Sales of Big Bear homes were the highest they've been in over a decade in 2017, more than double what they were in 2008 when "The Great Recession" hit. With buyer demand at a 10 year high, the Big Bear real estate market is in a very good place right now.


Big Bear Home Inventory

Buyer demand is one part of the economics equation. Supply is the other. Take a look at the figure below showing the number of listings on the market over the last 7 years.

Big Bear Home Listings HIstory

With the number of Big Bear homes for sale the lowest they've been in well over a decade, we have very little supply of homes for sale to meet the highest buyer demand in over a decade. This bodes very well for Big Bear real estate prices moving forward into 2018! Also, you can see the annual trend of listings peaking in summer then hitting their lowest point in the winter.


Months of Inventory

The most popular way for real estate economists to look at the supply and demand of a market is to do so in terms of "Months of Inventory". They derive this number by taking the number of current listings and dividing that by the number of sales from the previous month. This theoretically suggests how many months it would take for all the current listings to be sold at the current rate.

Big Bear Months of Inventory

A normal market has about 4 to 6 month of inventory. Currently we are at 2.2 months of inventory. This is the strongest indicator that the Big Bear real estate market is in a very good place. Lots of people want to buy a Big Bear home while very few are listed for sale. This means sellers will have more buyers competing to buy their home, and as such, prices should rise.


Other Factors Affecting Big Bear Real Estate

In addition to strong market numbers, the recent purchase of the local Big Bear Resorts, Bear Mountain and Snow Summit, by Aspen Ski Company/KSL Capital Partners has been received as a big positive by most buyers I have talked to.

Mortgage rates are still hovering around historical lows hanging around the 4% mark. The stock market had impressive gains in 2017, unemployment is the lowest it's been in 15 years, and the recovering real estate market has resulted in additional equity for homeowners. 

All these positive factors suggest a continued stable and strong market with further appreciation expected for Big Bear home values in 2018.

Posted in Market Reports