Your Big Bear Lakefront Real Estate Blog

An up-to-date resource for lakefront market reports, news, and infomation...

Feb. 4, 2019

2018 Big Bear Lakefront Real Estate Report

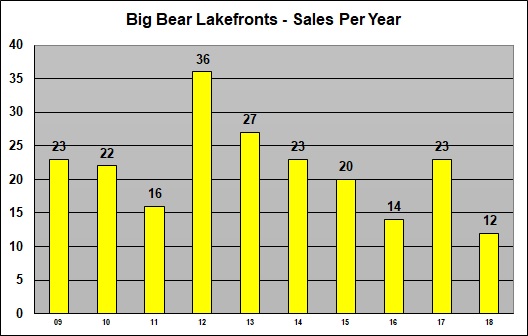
With Big Bear Lake's water levels at a 50-year low, lakefront sales were exceptionally slow in 2018 with only 12 closings - a record low since at least 2002 when electronic records started being kept. 

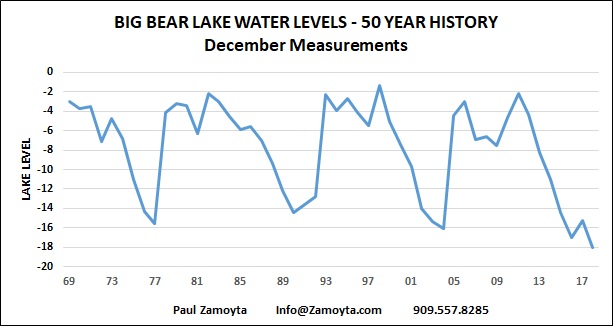
For an overall perspective of the 2018 Lakefront market, let's start with an historical perspective of Big Bear Lake's water levels over the past 50 years.

Big Bear Lake water levels

Although Big Bear Lake's water levels seem to have a somewhat predictable pattern of ups and downs over the last 50 years, prospective lakefront buyers were more hesitant than usual to commit to purchasing last year.


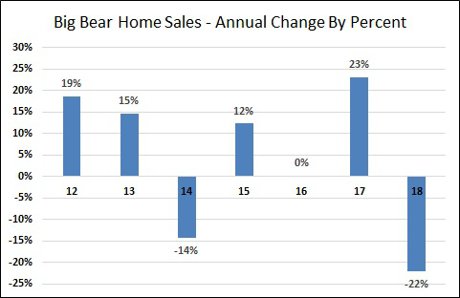
The result of this buyer hesitance was a significant slowdown in sales. Below you can see that 2018 was the slowest year for lakefront sales in over a decade.

Big Bear Lakefront Hoem Sales

To access e-flyers to all the lakefront homes that sold in 2018, click here: 2018 SOLD LAKEFRONTS 

Not unexpectedly, the slowdown in sales meant the average days on market increased, with it taking 226 days on average for the lakefronts that closed in 2018 to sell.

Big Bear Lakefront Days on Market


Lastly, there were several economic reasons for the slowdown in sales. The new tax laws limited the deductions on property tax and mortgage interest. As well, mortgage interest rates on a 30-year fixed loan rose significantly from a 2016 low of about 3.5% to a height of almost 5% in 2018. Fortunately, the Federal Reserve did not raise rates in January and mortgage rates have actually decreased once again to about 4.5%. That being said, higher interest rates usually have a negative effect on sales.


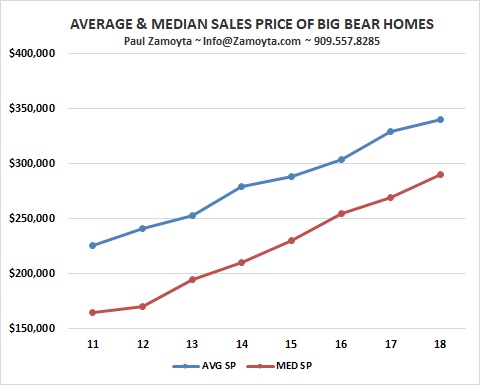
Due to the lack of sales, the average and median sales price numbers plummeted this past year. However, in taking a closer look at the 12 individual lakefront sales, you'll see this drop off can be explained and is not indicative of overall lakefront home values. Take a look below at the historical record of lakefront prices.

Big Bear Lakefront home prices 2018

On a whole, the precipitous drop in the average and median sales prices might suggest that lakefronts in general lost nearly half their values last year. But when you look at the individual lakefront sales more closely, you see that the majority of sales were smaller, less expensive, and generally shallow water homes that were largely affected by the lake levels.

Many of these lakefronts had docks that were beached and would need to see a substantial rise in the lake's water levels before offering lake access. These sales often represented sellers motivated to get out of the market quickly after spending some time listed at higher prices, but ultimately deciding to sell at a discount. On the other side of these transactions were buyers looking to invest in anticipation of significant price appreciation when the lake's water level eventually comes back up.

To see the extent to which lakefront sellers lowered their list prices in order to get sold, take a look at the figure below showing the sales price to original list price ratio.

Big Bear Lakefront Real Estate Sales price to list price

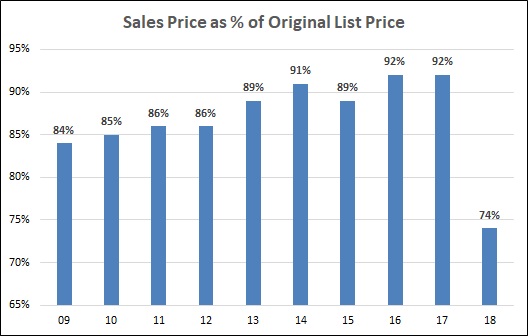
In 2018, lakefront home owners came down off their original list price an unprecedented 26% to arrive at their eventual negotiated sales price. As one would expect, these motivated sellers were another factor that contributed to the unusually low average and median sales prices in 2018.

Lastly, 2018 saw a significant slow down in higher-end home sales which further skewed the average and median sales price numbers lower. The most expensive of the 12 homes to sell in 2018 was sold at $1,125,000.

In 2017, there were 10 sales over this amount, including three sales over $2M and two sales over $3M. Some of the absence of high-end lakefront sales was due to the lake's water levels, but there was also a lack of competitively priced high-end lakefront homes listed for sale as well. Regardless, fewer high end sales resulted in a much lower average sale price.

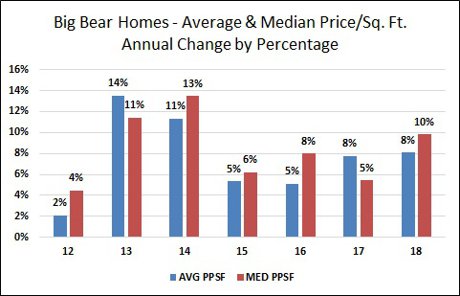
Ultimately, I feel the price per square foot measure below offers a better perspective of lakefront home values.

Big Bear Lakefronts Price Per Square Foot

From a price per square foot perspective, you can see a relatively stable trend around $450/sf over the past five years. With the exception of shallow water lakefronts, I think that lakefront home values stayed relatively constant in 2018 in light of slowing sales.


In summary, sales of Big Bear lakefronts lagged in 2018. This can be attributed to Big Bear Lake's water levels hitting a 50-year low, rising interest rates, and limitation on mortgage and property tax deductions.

The average and median sales prices dropped almost 50%, but this can be simply explained by many smaller, shallow water lakefronts selling at a discount price along with a lack of sales in the higher end price ranges. More accurately, the median and average price per square foot of lakefronts stayed relatively constant at about $450 per square foot.

Looking forward, guessing what the market will do in 2019 is difficult to say the least. From a buyer's perspective, the slowdown in sales may be an opportunity to purchase a lakefront with sellers pricing their homes more aggressively in an uncertain market before the market turns upwards again. Conversely, current lakefront owners may have the opportunity to realize the gains of the past 8 years by selling at what might be the market's peak.

Regardless of market forces, we have had one of our busier winter seasons as more and more visitors are discovering what a special place Big Bear is. With the continuing development of our local resorts and village area, Big Bear's appeal continues to grow. This bodes well for Big Bear real estate through the near future and hopefully well beyond!


Paul Zamoyta ~ 909.557.8285 ~ Info@Zamoyta.com


No other agent has represented more buyers or sellers of

Big Bear lakefront homes in the past 5 years.


Jan. 17, 2019

BIG BEAR HOME SALES ~ 2018 YEAR IN REVIEW

With 2018 a few weeks behind us now, let's review how last year's Big Bear home sales fared. Here's a look at the numbers followed by a summary of where the Big Bear real estate market has been and where it might be headed.


BIG BEAR HOME SALES

First, let's start with the number of Big Bear homes that sold. Below is a yearly comparison of the number of Big Bear homes sold and a figure showing the percentage change in Big Bear home sales from the previous year.

Big Bear Home Sales - 2018

Big Bear Home Sales

You'll see from the figures above that Big Bear home sales dropped 22% in 2018, but that's in comparison to an exceptional 2017. From a longer term perspective, 2018 sales were almost on par with 2015 and 2016 sales, representing what we would expect in a more normal market.


BIG BEAR HOME PRICES

Take a look at the history of average and median sales prices followed by the annual percentage of change in prices from the previous year.

2018 Big Bear Home Prices

Although sales adjusted back to a more normal level, the average and median sales prices of Big Bear homes continued to rise. We saw the average and median sales prices increase 3% and 8% respectively in 2018.

This trend can be seen in the price per square foot measures too.

Big Bear homes price per square foot 2018

2018 saw an 8% and 10% rise in the average and median sales prices respectively. So prices continued to rise last year in light of slowing sales.


DAYS ON MARKET

Next, let's look at how quickly Big Bear homes sold in 2018.

2018 Days On Market Big Bear Homes

The figure above shows that homes sold quicker in 2018 than at any time in the last 5 years, posting the lowest median and average days on market since 2013. In a period of slowing sales, homes spending less time on market suggest more aggressive pricing on behalf of sellers.


HOME INVENTORY

The average numbers of homes for sale rose slightly last year, but were still historically quite low.

This slight rise in the average number of listing is likely due to the slow down in home sales. But as previously mentioned, inventory in 2018 remained close to a 10 year low.


MORTGAGE RATES

Interest rates rose through most of 2018, but had a welcomed drop towards year's end.


mortgage rates

You can see that rates bottomed out in 2016 at about 3.5% and then peaked in November close to 5%. Rates have settled back down since to the 4.5% range.


IN SUMMARY

Putting it all together, 2018 saw a drop in the number of Big Bear home sales but all other real estate measures were in positive territory.

The slow down in sales can be attributed to many different factors. After 7 years of price gains, affordability is starting to challenge some buyers. New tax laws limit mortgage and property tax deductions making home ownership somewhat less advantageous from a tax perspective. Mortgage rates have risen from 3.5% to 4.5%, which represents about 12% increase in payments on an average priced Big Bear home. 

Although all these factors were likely the reason for slower sales, some industry pundits feel that after the initial negative effects of the increased interest rates and tax implications, these factors will become "the new normal" and have less impact on sales moving forward. (Conversely and anecdotally, I have had a few clients claim they were buying now before interest rates go higher. So in some instances, rising rates are encouraging sales!)

If there's one thing I've learned over decades of working, owning, and investing in real estate, it is that no one can predict with any certainty what the market will do. However, based on the overall strong market numbers from 2018, with a healthy level of buyer demand and relatively low supply of homes for sale, and with rising interest rates seeming to have slowed and remain at historically low levels, I am optimistic that 2019 will be another bullish year for Big Bear real estate.


Posted in Market Reports
Dec. 12, 2018

Just the Facts About Big Bear Lake's Fluctuating Water Levels

With the overall health of Big Bear's economy in large part revolving around the overall health of Big Bear Lake, those of us interested and invested in Big Bear real estate like to keep a close eye on the lake's water levels. In a year in which the lake's water levels have fallen to their lowest point in over 50 years, it seems like more misinformation and uninformed prognostications than usual have crept into the various narratives surrounding the past, present, and future of Big Bear Lake.

So I wanted to share some historical information about the lake and dispel some of the more common myths surrounding Big Bear Lake's water levels.

Being that a picture is worth a thousand words, let's start with taking a look at this figure of 50 years of water level measurements of Big Bear Lake taken in the month of December. (Source: Big Bear Municipal Water District Lake Measurements)


Big Bear Lake's Water Levels - 50 Year History 


Although the lake is at it's lowest point in over 50 years, there has been a fairly regular pattern of ups and downs of water levels over time. Also of note from this graph, it appears that when Mother Nature does decide to show up, the lake fills quite quickly, often in the course of just one winter and following spring.

There is certainly no guarantee that this pattern will continue. But we all know that history has a way of repeating itself, and if that ends up being the case, we are due for a refill of the lake quite soon. 

With this history in perspective, let's take a look at some of the most common misconceptions revolving around Big Bear Lake's water levels. (Source: Big Bear Municipal Water Department - Fact or Fiction)


WATER BEING TAKEN FOR SNOWMAKING IS DRAINING THE LAKE.

FALSE - The truth is that snowmaking takes only about 3.5 inches from the lake with about half of this returning to the lake as spring snow melt.


THE LAKE IS LOW BECAUSE WATER IS RELEASED TO FARMERS DOWN THE HILL.

FALSE - The truth is that the lake district has been purchasing water off the hill to satisfy contractual obligations. This helps keep more water in our lake!


THE LAKE IS LOW BECAUSE OF CONSTANT WATER RELEASES.

FALSE - Yes, there is a mandate that a certain amount of water be released constantly from the dam for environmental reasons. But this only accounts for about 2 inches of lake level each year. In perspective, annual evaporation accounts for about 3.5 feet of surface loss!


THE LAKE IS AT ITS LOWEST POINT EVER!

FALSE - The truth is that the lake was 51 feet down in 1956, BEFORE the Lake District was formed to help manage water levels. It is because the Big Bear Municipal Water District was formed that we are able to keep devastating lake levels like these from occurring again!


With the lake's water level having risen 4 inches in the just last few weeks, I am hoping this is just the beginning of what will end up being one of those winters in which our lake will look remarkably different come spring time. But don't get complacent! Keep doing those snow dances so Mother Nature knows how badly you want a very white (preferable) or wet (we'll take what we can get) winter! 


Dec. 6, 2018

Keeping the Sales Drop In Perspective

I received a comment regarding the extent of the drop in sales of Big Bear homes. A reader was startled that there were 36% fewer sales this November as compared to last November and felt this might be a portent of a significant market change. There is no doubt that after 8 years of a bull market in Big Bear real estate that the market is shifting. But will the market "crash" like in 2008 - 2010? Let's look at the numbers to put things in perspective.

Here's a graph that shows the rate that Big Bear home sales have slowed. Because sales are seasonal in Big Bear, I compared the sales from a particular month to sales from that month from the previous year.

Big Bear Home Sales Change Per Mont


Solely looking at this graph, you would think that the shift in the Big Bear real estate market suggests a dramatic drop might be happening. But let's put the sales for the year in perspective by looking at a longer trend shown by this other graph. (I projected the sales for 2018 through the end of the year. Being that we're in December, it should be a quite accurate estimate.)


Considering this longer term look, we see that 2017 was an exceptional year for sales and that his year's drop brings our market back to where things were in the strong recovery years of 2015 and 2016.

Ultimately, it's no secret that the market is shifting. But there are two factors which suggest we are reverting back to a more normal market rather than towards a significant market drop: interest rates have risen but are still at historically low levels, and the supply of homes for sale is still low which suggests prices should continue to rise, albeit perhaps at a slower rate. So long as rates stay low and the number of homes for sale stay low, the market will retain its stability. There are no other known market conditions, like the sub-prime loans in 2008, that would suggest a more exaggerated shift may be happening. A reversion to the norm is a much more likely prognosis for the Big Bear real estate market.

With our second winter storm moving through the area today, we should see a lot more activity in the real estate market as many holiday visitors will become Big Bear home buyers. I hope this will result in a jump in the sales numbers and a strong start in 2019!

Posted in Market Reports
Dec. 5, 2018

Big Bear Real Estate - November Sales Report

In a November same month comparison, sales of Big Bear homes continued to slow down to 2015 and 2016 levels after a banner year in 2017. Although Big Bear home sales were down by about a third, prices continued to rise.

This November, the average and median sales prices were up 7% and 4% to $346,807 and $285,000 as compared to November 2016. The average and median prices per square foot were also up 3% and 6% to $239 and $234. The average days on market dropped from 120 to 103 while the median days on market stayed even at 85.

Looking at year-to date numbers, through the first 11 months of 2017, sales are down 21% bringing them back to 2016 levels, but prices have continued to rise nonetheless. The average and median sales prices are up 5% and 10% to $339,164 and $289,000 while the average and median prices per square foot were also up 9% and 10% to $242 and $236. The average days on market dropped from 108 to 91 and the median dropped from 74 to 63.

The number of Big Bear homes for sale is higher than last year at this time, but still at a low level historically. Interest rates seemed to have leveled off after rising throughout the year.

Perhaps the best market news is that our local ski resorts were open for Thanksgiving and we've had two good snowstorms so far this year. The lake rose 3 inches last week and is likely to rise more this week. With Big Bear's economy depending largely on ski conditions and a healthy lake, these storms bode well for the upcoming Holiday Season as well as the fast approaching New Year!

Posted in Market Reports
Oct. 25, 2018

Big Bear Lakefront Real Estate Update - Fall 2018

It's been an interesting year for the Big Bear lakefront real estate market. With Big Bear Lake's water levels hitting a 50 year low, to say that lakefront home buyers have been hesitant is an understatement.

Before looking at the numbers, let's take a look at the history of ups and downs the lake has experienced over the years.

Big Bear Lake Levels

Note the fairly regular declines and quick refilling that Big Bear Lake has experienced several times in the past. Many people reason that the pattern above suggests that we will see a rebound in the lake levels this winter. Although no one can say with any certainty what will happen, it does seem plausible that we might see significantly higher water levels by next summer.

Regardless, many buyers have justifiably been hesitant to invest in lakefronts with the water level significantly down. This has resulted in a decline in lakefront home sales with only 10 closings so far this year. This is a measurable drop from the 23 Big Bear lakefronts that sold last year.

But there have been some lakefront sales nonetheless, as buyers are literally buying low in hopes of profiting when the lake's levels are once again high. It is no surprise that shallow water lakefronts, many with beached docks, see their values decline significantly when the lake's water level is so low. Some savvy buyers have been willing to buy these homes in anticipation of a more full lake in the near future. Although there is the risk of the lake's water levels continuing to decline, many of these homes will see $100,000 or more in appreciation simply by the lake filling up. 

As well, many people who have dreamed on owning a Big Bear lakefront home but who have always been "priced-out" are now able to afford a waterfront property now that the low lake level has resulted in lower prices.

As a result, with most purchases being shallow water lakefront homes this year, the average and median sale prices have plummeted. The average sale price of a lakefront home last year was $1,380,257 as compared to this year's average sale price being only $768,740. Obviously, this does NOT mean lakefront values have declined by 40% on a whole. It means that the environmental conditions have resulted in a shift in the type of lakefronts that are being purchased, which are generally of a less expensive variety.

Ultimately, the Big Bear Lakefront real estate market relies in part on Mother Nature in determining values. If the 50 year pattern extends to the near future, we should see a significant rebound in sales. In 2004, the lake was over 17 feet from full, just one foot higher than it is now. After a very wet and snowy winter, the lake's water levels rebounded to just a few feet from full by the following May. The result? Lakefront sales almost doubled in 2005, with a record 43 sales in 2005!

So the outlook for the Big Bear lakefront real estate market will depend on what Mother Nature has in store for us this winter. If the past is any indication of the future, next year could be a pretty big one for Big Bear lakefront home sales!


Oct. 9, 2018

Big Bear Real Estate Market Update Through 3rd Quarter of 2018

Now that the third quarter is behind us, I thought I'd take a look at how Big Bear real estate has fared through the third quarter of 2018 as compared to the same time period in 2017.

Overall Big Bear home sales have slowed significantly so far in 2018, dropping 19% from the previous year. But looking at the longer term trend below, it looks like we might be settling down into a more normal market after what was an unusually strong year in 2017.

Big Bear Home Sales - Quarterly

Meanwhile, all four major price measures have shown improvement in our year-to-date comparison. 

The average and median sale prices of Big Bear homes are up 3% and 7.5% to $337,334 and $289,000 respectively, while the average and median prices per square foot are up 10% and 11% to $232 and $224 respectfully.

Big Bear homes have sold slightly quicker this year with the average Days On Market dropping from 103 days to 90 days. The average sales price to list price ratio has stayed steady at about 97.7%.

The number of Big Bear homes for sale has risen slightly this year but is still well below the long term average. Currently, there are 506 homes for sale in Big Bear, whereas last year there were 410 homes for sale and 2016 saw 554 homes for sale in mid-October..

With interest rates rising and with so few homes for sale in Big Bear, home sales settling back down to a more historically normal level is not so surprising. The market seems to be neutral currently, as the shift is underway from a seller's market to a buyer's market.

Regardless, if you've considered selling your Big Bear home, it makes sense to think more seriously about this possibility with buyer's starting to gain the upper hand in negotiations. If you're a buyer, you will want to move quickly to take advantage of historically low interest rates before they rise further while keeping an eye out for motivated sellers looking to stay ahead of the market shift by conceding more in negotiations than they would have otherwise.

If you have any questions or comments, please contact me at Info@Zamoyta.com or (909) 557-8285.


Posted in Market Reports
Sept. 7, 2018

August 2018 Big Bear Real Estate Market Numbers

Although the number of sold Big Bear homes dipped in August, prices continued to rise on a same month comparison basis.

Big Bear home sales dropped from 143 closings last August to 104 this August. In spite of this, all four major price measures appreciated with the average and median home prices rising 7% and 11% to $340,246 and $282,250 respectively and the average and median price per square foot rising 4.5% and 5% to $240 and $229 respectively.

The average Days On Market for sold Big Bear homes rose slightly from 96 to 103 days, while the median remained the same at 70.

On a year-to-date basis, we see the same trends with sales dipping but Big Bear home prices showing continued appreciation. Comparing sales through August this year to those of the same time period last year, we see that the average and median Big Bear home prices are up 7% and 13% to $343,950 and $290,000 respectively while the average and median price per square foot rose 14% and 10% to $248 and $238 respectively.

The Days On Market dropped from 103 to 91 days while the median fell from 68 to 62 days.

The inventory of Big Bear homes for sale is up slightly, with 497 homes listed for sale in mid-August last year to 529 homes listed for sale in mid-August of this year. For a perspective, August 2011 saw an inventory of 838 homes for sale. 

Mortgage rates have continued to creep up with conventional 30 year interest rates hovering around 4.5% - still an extremely low rate from an historically perspective.

With summer behind us and gear shifting towards the upcoming winter season, we will see an overlap of late summer buyers with early winter buyers which should keep sales strong through the end of the year.


Posted in Market Reports
July 5, 2018

Big Bear Real Estate Update - June 2018

Same Month Comparison - June 2017 Compared to June 2018

After several months of all positives, we get some mixed messages in June's real estate numbers. But the overall trend for the year continues to show strong gains and a healthy market.

Sales were down 19% this June as compared to June 2017, most probably attributed to the poor winter season we had. As well, after several months of price appreciation, the average and median home prices dropped 7% and 4% to $312,927 and $282,000 respectively. Yet the average and median price per square foot measures were up 3% and 8% to $233 and $239 respectively.

The Days On Market remain slightly lower with the average dropping from 98 days last June to 77 days this June. The average sales price to list price ratio stayed about the same around 98%.

As I often mention, monthly trends can be less accurate due to the relatively low number of sales we see in our small market area. So looking at the longer term trend such as a year-to-date comparison can sometimes be more accurate.

Year-To-Date Comparison - 2017 to 2018

Sales this year are still down through June of 2018 with 14% fewer closings this year.

Yet the average and median sales prices are still up 10% and 12% to $346,583 and $290,000 respectively. The average and median price per square foot measures are also up 12% and 13% to $241 and $237 respectively.

The average Days On Market are down from 105 last year to 91 this year while the sales price to list price ratio stayed about the same at 98%.

Market Summary

Although interest rates have crept up into the mid 4% range and Big Bear home sales have subdued due to a slow winter, inventory remains low which is keeping prices moving in the positive direction. With the year's first good heat wave of the summer now gripping the Southern California, Las Vegas and Palm Springs areas, we will likely see sales jump next month as people seek a respite from the scorching temperatures by visiting Big Bear's cooler climate. With the increase in visitors, I would expect an increase in sales.


Posted in Market Reports
June 6, 2018

Big Bear Lakefront Cash Sales

I had a prospective Big Bear lakefront seller ask me the other day how often buyers purchase lakefronts with cash. I hadn't run those numbers recently so I decided to take a look.

Looking back through 10 years of lakefront homes sales in Big Bear, 88 out of the 220 sales were cash purchases, representing 40% of all sales. 

Of course this lead to other questions, such as whether the cash purchases were more frequent among higher-end lakefront sales or lower-end sales. When breaking down the average sale price of cash sales and non-cash sales, you get about the same results. The average sales price for cash sales was $1,269,436 whereas non-cash sales were slightly lower at $1,209,092.

How about trends? Have there been more cash sales over the last few years, or fewer? Looking back over the last 3 years, there have been 22 cash sales compared to 23 non-cash sales, with cash sales of Big Bear lakefronts almost being equal to non-cash sales. It's a pretty small sample size, but it would  make sense that cash sales have become more prevalent in today's booming economy.

As many realtors often say, "Cash is King", meaning that cash offers trump other non-cash offers and often times allow the buyer to pick up property at a discounted price. So I looked at lakefront cash purchases to see if they were able to gain a price edge in negotiations. Looking at the data, cash sales were purchased on average at 93.9% of list price whereas non-cash sales were bought at 94.03% of list price. So it appears that there was no significant cash discount when lakefront home buyers purchased with cash.

Lastly, I wondered if the 40% of lakefront cash purchases was more than that of non-lakefront purchases. It turns out that 35.2% of all Big Bear homes sales are cash. So Big Bear lakefronts are more likely to be purchased with cash than non-lakefronts, although only 5% more likely.


Posted in Market Reports